Tuesday 4 May 2010
Yesterday, we stated we were short from the 1187 area and gave longer term
chart perspectives as to why price may decline. After Friday’s steep drop, three
possibilities could develop for Monday, yesterday’s trade. 1. Sharp continuation
follow-through down. 2. A trading range while sellers continued to absorb buyers.
3. A rally that negated Friday’s drop. What we got was a hybrid of 2. and 3.
which turned out to be another failed retest rally.
It is not always comfortable to sit through a correction against one’s position,
but if the analysis is on point, stops are in place, the position should work.
Given how pre-opening day session prices are 800-900 lower, as this is written,
holding the position was the proper stance to take.
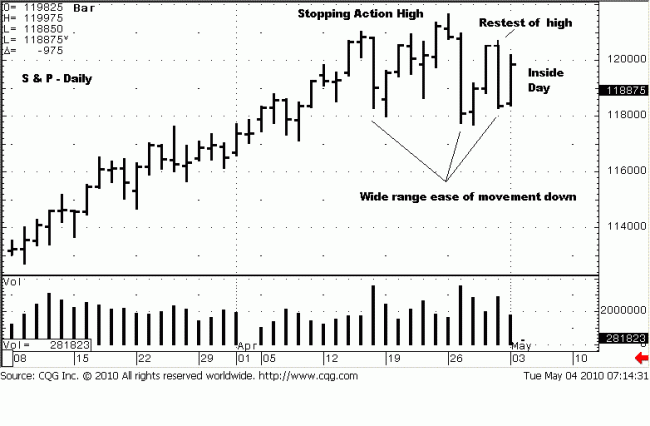
The daily chart shows that a week ago Monday was a small range, low end
close. This says that buyers were spent in being unable to extend the range
higher, and the close says sellers won the battle that day. This kind of small
range, low end close bar can be stopping action. As it turns out, the whole week
became an OKR, very negative. [See S & P – May You Live In Interesting Times,
second paragraph after first chart].
Note how the three largest bars are days where price declined. This tells us that
selling is present and persistent. We viewed this as distribution,
[see S & P – Plan A Or Plan B?, second paragraph]. After Friday’s decline, the
activity said that Friday was a failed retest of the previous Monday high, and price
is likely to go lower, and we gave the three possibilities above.
While yesterday made things a bit tenuous, we were comfortable with the
analysis and prepared to be wrong, if stopped out, for the short position was
entered for all of the right reasons. For as long as any position is entered for
good reason, the winners will take care of the losers, so one has to hold steady,
and let the market run its course.

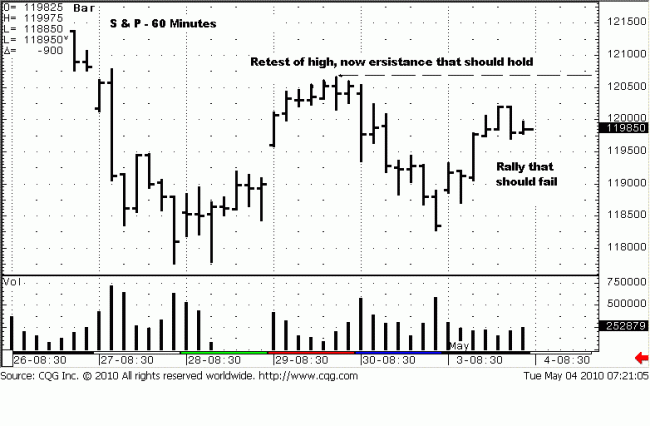
The 60 Minute chart is included just to show the failed retest high from Friday
that should, if the analysis is correct, act as resistance. The market rallied 20
points, a strong showing after the Friday drop, BUT, the rally never exceeded
the resistance area. We can live with that.
Today may offer another shorting opportunity if a weak rally develops.
Tomorrow, or soon, we will show a monthly chart that we will use to point out a
downside target that may make jaws drop.
Holding.
[Our blog is till down.]


