Thursday Evening 24 June 2010
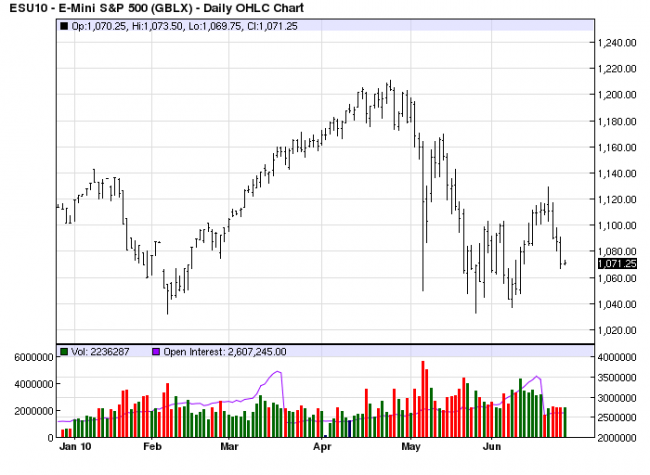
Once the S&P put in a surprising 6 day rally, it changed the complexion of the
down trend and gave new expectations for upside potential. There was now
potential for a rally to 1141, to as high as 1170, and that had to be respected.
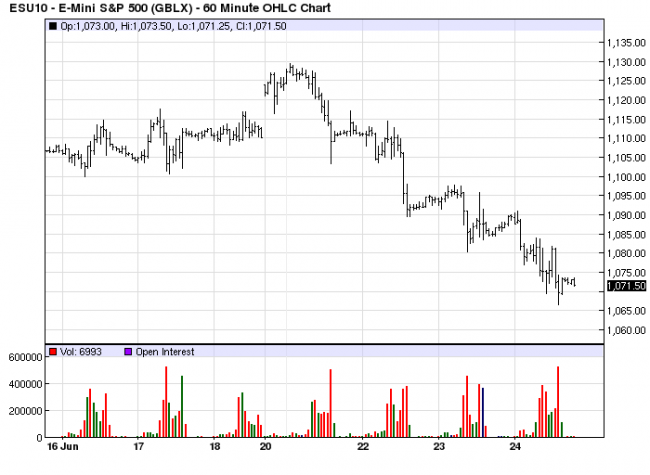
Monday’s failure rally after the large runnup put a damper on the upside, but
it needed to be proven. The wide range decline on Tuesday helped that proof
along, but Wednesday’s lower volume, smaller bar and mid-range close
suggested price was stopping at a possible support area, with another support
just under that low, both suggesting caution to the short side.
Or so it seemed.
Thursday’s continuation down kept sellers in control as price held the half-way
correction point only briefly before giving way. All rally attempts on the way
down had been anemic, but selling volume was not that convincing. Still, price
declined convincingly 63 points from Monday’s 1129.50 high.
Not once did we get short as we waited for a larger counter-rally that never
came. Prior to the 1183 area, there was no sound reason to be short, not in
light of that area holding previously. Once it was broken, then the requirement
of a failure rally failed to occur. As a cautious result, we missed this decline.
It happens. Now what? There is no greater bull than a sidelined bear, so we
have been eagerly awaiting a rally.

The 60 minute chart shows a clear trend down, in a neat little channel. After
three days of lower lows, the volume activity going into the close suggests the
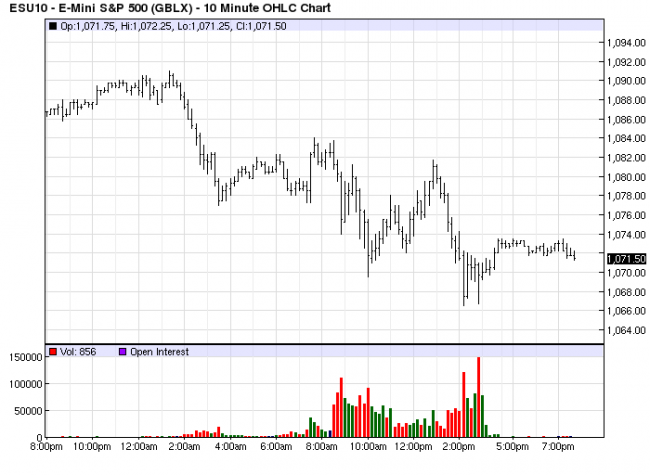
potential for a rally. It looked like the 1070 area would hold, mid-morning. Not
a chance. After another weak intra day rally, another low was created. The
reasoning for the outlook behind the 1070 low holding was the increased volume,
the largest on a 10 minute bar for the whole day.
Going into the last hour, volume picked up as price declined to yet newer lows,
and it is apparent that the last hour’s volume was the highest of the day, even
for the week. It is possible that it was what is called stopping volume. Note how
high the volume is, and then look at the size of the range. The sharp increase
in volume activity is disproportionate to the smaller range. It says buyers,[short-
covering], were present to prevent the range from extending further down. A
10m chart will show it even more.

The 10:00 a.m. low had the potential for holding up until the last bar before
2 p.m. The 2 p.m. bar closed on the low and gave scant hope for the 1070
area to be the day’s low. What developed after that time became very
interesting. At 2:10 p.m. there was a new low on increased volume. The
sellers were totally in control, and more downside could easily follow.
Now you will get to see what is meant by stopping volume. The highest 10
minute volume bar in the past week produced not a new low, not a bar with a
low-end close, but a retest of the previous low and and a higher end close.
The only reason why the close was upper end was because buyers stepped in
and bid up the price. [We say buyers, but in the form of short-covering,not new
demand].
The sharply increased volume stopped the decline. Keep in mind, price is
down three days and 63 points with hardly any counter rally. We are of the
mind that the odds have increased for the beginning of a short-term market
trend change, based on an hourly chart. “Bear” in mind, this has to be proven
by a rally on increased volume and a higher swing low. If this does not happen,
price will continue lower.
Still on the sidelines, but drawing a bead on developing market activity.


