Thursday 11 March 2010
Yesterday, we presented a weekly chart showing the primary S & P trend,
suggesting that it has room to go much higher, S & P – New Highs Coming,
Or At A Top?, [click on http://bit.ly/d7ssWg]. All that it needs is confirming
market activity. Today, we will look at the daily chart to show how the market
can pause here, or even fail.
The odds of failing up here are smaller because of the established up trend,
and it is up to sellers to step in on increased volume to push the market lower
on ease of movement to the downside. Until that happens, price will work
higher, but mention of that possibility is made to be alert for that kind of
developing market activity.
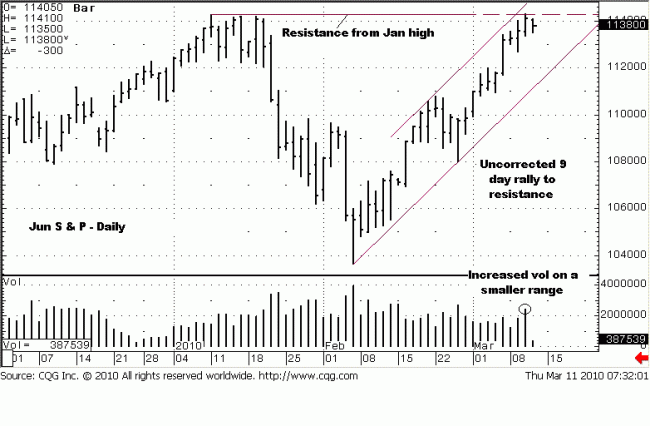
We noted, on the bottom of the chart, that volume increased yesterday,
second bar from the end, [the last bar on the chart is early morning, pre-
opening activity.] The range of yesterday’s bar was relatively smaller for the
increase in volume. This tells us that there were some sellers in the market
that kept price from going higher. However, the upper end close also tells us
that buyers remain in control.
Another consideration is the fact that price has rallied uncorrected over the
last nine trading days, and buying after an uncorrected move, at a recognized
resistance area, invites paying up to get long and having to sit through a likely
correction. A correction may not come, but because this activity took place
at an area of resistance, the previous January highs from which price corrected
lower, we can expect some short-term selling against that resistance level.
Based on what was seen on the weekly chart presented yesterday, and this daily
chart, corrections can be bought in anticipation of higher prices.
The 1200 area is certainly one of support, based on the channel and previous
activity from January. A new support level may develop above 1200. Wherever
support comes in, going long makes the most sense.


