Monday 14 December 2009
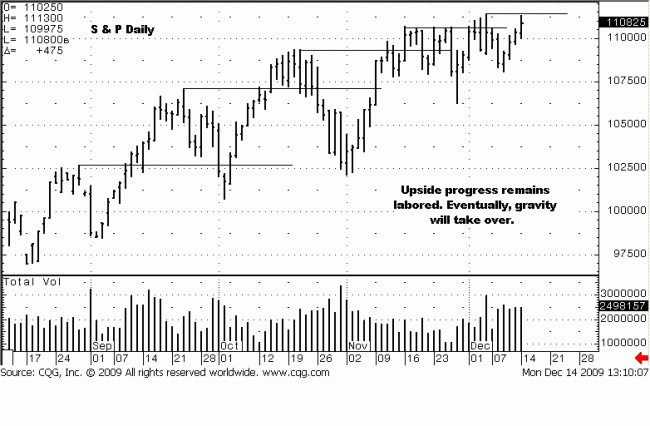
Price action of the past 6 trading days has been contained within the
week-ending 4 December weekly range. The highest volume since late
October occurred on the Friday jobs announcement from the 4th. It is
apparent that volume has picked up, relatively speaking, yet price cannot
rally above resistance, nor can it break support. On a weekly chart, not
shown, price remains in a 12 week range that has an upward slant to it.
There is a smaller trading range within, apparent on the daily chart. [there
is even another smaller trading range in the intra day charts within the daily
chart.]
Demand has not been that great, and as we continue to point out, supply is
dismal, so the market continues to hold the upper reaches of the trading
range, as demand wins by default. The ONLY thing that will turn this
weakened trend is supply, [Economics 101]. It is unlikely that there will be
any supply until January, at best. Politics wants to keep the market positive,
and Wall Street bonus-anticipators will do nothing to upset their year-end
bottom line. The doldrums will likely continue.
[See S & P – Out Of The Shorting Gate, Or Another False Start?, where we
discuss the difference between supply and selling, half way through the article.]
We have drawn horizontal lines to show swing highs and to highlight how those
same swing highs are getting shorter and shorter. The trend is running out of
steam, plain and simple. This kind of strugging market environment is what
turns a market, and eventually, gravity alone will cause the anticipated break
to occur.
What needs to be said is the fact that since 9 December lows, 1080, each
succeeding bar has a higher high, higher low, and a higher close, as price
approaches the resistance area, again. There are only three events that can
occur: 1. The rally will continue, [we would think in the form of another failed
probe higher], 2. more of the same, [trading ranges within a larger trading
range], or 3. a decline sets in.
The shortening of upside swing highs has ominous implications for the up
trend continuing. The protracted trading range has a double edge to it. A
trading range builds cause, [energy], which can be measured by Point and
Figure charts. The measure gives an indication of how far a move may
travel. Right now, the potential downside is close to 100 S&P points, carrying
down to the October lows, 1007 area. Before that can happen, there must be
evidence of supply selling coming into the market. Until then, price will respect
the Law of Supply v Demand, and eventually, the Law of Gravity will come into
play.
Lock and load is the call of the day, waiting for a reason to take action, in
either direction.


