Thursday 8 July 2010
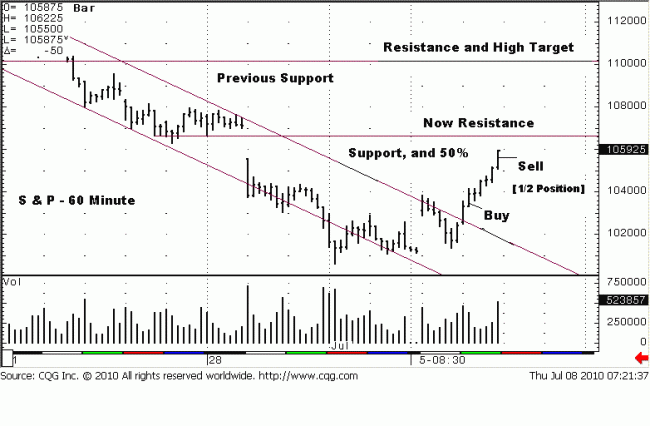
The 60 minute chart shows our entry from yesterday and where half the position
was liquidated. The upside targets have been identified, as well. The next upside
resistance is the 1067 area. You can see that is was previous support from late
June, and it is also a 50% retracement from the 21 June high and 1 July low.
Whenever there is a convergence of two or more indicators at one price level, it can
have more significance. It will be important to see how price reacts to it, IF price is
able to rally that high. A failure to reach that area would be a message in and of
itself, and a sign of weakness.
The longshot target is the upper horizontal line at the 1104 area. It is where price broke important support for the highs in mid-June. There are a few other potential areas of resistance, but for now, we will deal with what is, today.


