Monday 30 November 2009
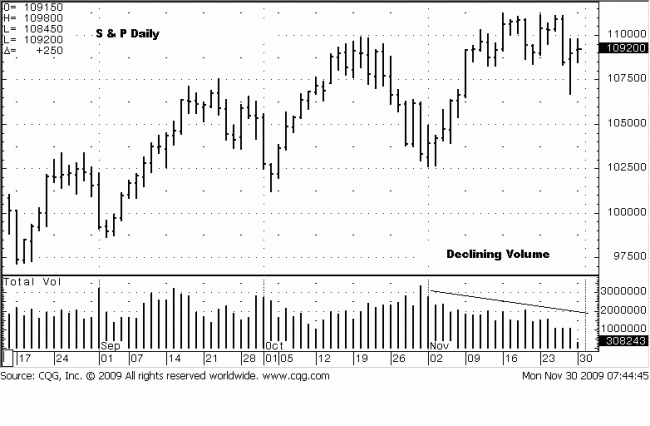
What is missing is supply. What is also missing is demand. As price has rallied
throughout November, the level of volume keeps declining. A decline in volume
says that demand has weakened, and this opens the door for sellers to come in
and take advantage of weakness. The problem with that is there are even less
sellers willing to enter the market and push price lower when it would be easy to
do so, [less demand to stop selling efforts].
The S & P market has become a battle of the absentees. “Here, sellers, you
take over!” “No, buyers, you stay in charge.” Well, because the trend has been
higher, since March, buyers remain in control by default. It is incumbent upon
sellers to prove they can take over to change the trend, and that is not
happening.

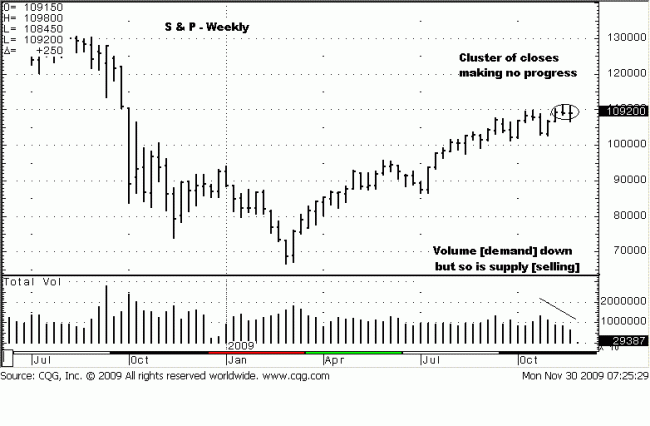
A Look at the weekly chart shows the dilemma by a cluster of closes over the
the past three weeks, with buyers making scant upside progress over the
October highs. The week before last, second bar from the end, has a low end
close that says sellers were “stronger” than buyers, but there has been an
inability for sellers to exhibit downside follow-through. The lower low from last
week occurred over a three hour span in response to the Dubai debt situation,
and price closed about mid-range, a stand-off of sorts between supply and
demand. Declining volume says no conviction, either way.

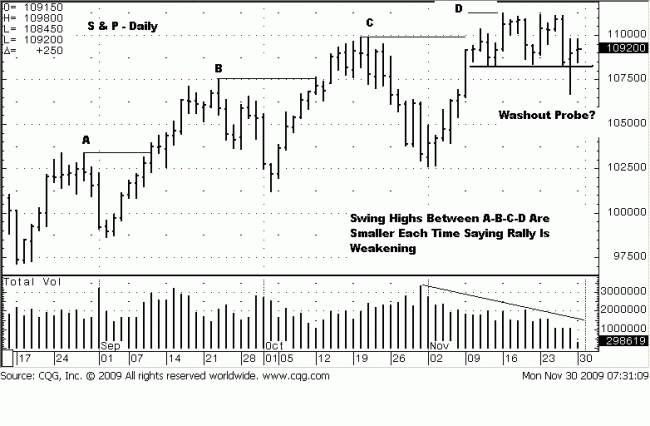
The daily chart does little more to add any clarity. The highs, as shown below,
have gotten successively smaller on each rally. This indicates a weakening of
the trend, but however weakened, price continues higher.
Regardless of what precipitates a price move, the net effect is printed
permanently on the chart. The spike low on Friday presents an interesting
scenario that could lead to a sharp breakout rally that carries price to the 1200
– 1220 area. Here is why.
Where the weekly chart was neutral in close, [mid-range], the daily closed on
the upper end of the spike lower on Friday. This demonstrates the strength of
the trend and an ability for price to be resilient in the face of a sharp drop.
The ability to recover indicates that sellers cannot take advantage of ANY price
weakening. This leads us to take a different look at the market’s inability to
maintain upside momentum. New information always demands one be flexible
in assessing market direction.
The weakened swings higher can well be the market’s way of absorbing what
little selling effort there has been. The cumulative effect of selling effort has
slowed, but not stopped the trend from continuing higher. With this washout
of sellers, including sell-stops, this could be the impetus to propel the market
higher, for one last gasp. Should this occur, the next likely resistance on the
weekly chart is the 1200 – 1220 area.
Note that from last Thursday’s high to Friday’s low, price declined 44 points,
but closed above the mid-point of those two days, showing the edge to buyers.
A weak retest of Friday’s low would tell us to look for a rally. An inability of
demand to continue this opportunity will simply lead to more of the same.
A few other points to consider. The Russel 2000, a broader index, has been
the weakest of all. The Nasdaq, the leader behind the market rally, has also
weakened, as has the spread between it and the S&P. Essentially, the level of
knowledge is not high in the market, and that perhaps is the most conclusive
bottom-line assessment. When the level of knowledge is low, the odds of
being wrong increase.
There is no edge, and that is the message of the market, for now.


