Thursday Evening 24 September 2009
There is no greater and more reliable source of market information than that which is generated by the market itself. It is the distillation of all known information and judgments expressed in price activity and volume, and it is all undisputed recorded fact. There are times, however, when reading/interpreting the facts can be tricky.
One recent time was discussed in our article from the 19th, “The Beginning Of The
End?”
In that article, we drew attention to the high volume days and finally realized their
importance…it was a distribution of stocks from strong hands, [smart money], into
weak hands, the kind of buyers who act on the information bandied by the talking
heads on financial neteworks who see nothing but blue sky, no matter how cloudy.
There was the message of the market, showing up in the bright light, unhidden, if
one knew how to read the “obvious.”
Many, in fact most cannot subscribe to the notion that astrology can have an
impact on the markets, but our firsthand experience and our knowledge of the
works of W D Gann, considered one of the best traders in market history, tells us
there is a correlation. It is beyond our ability, but it is there. We mentioned, a
week before, how a top was being called on 17 September based on planetary
aspects, [As Above, So Below], and we watched the markets after the 17th like a
mother hen. On Wednesday, SPY made a double top, and the futures had a
failed probe of the highs from the 17th, confirming their validity.
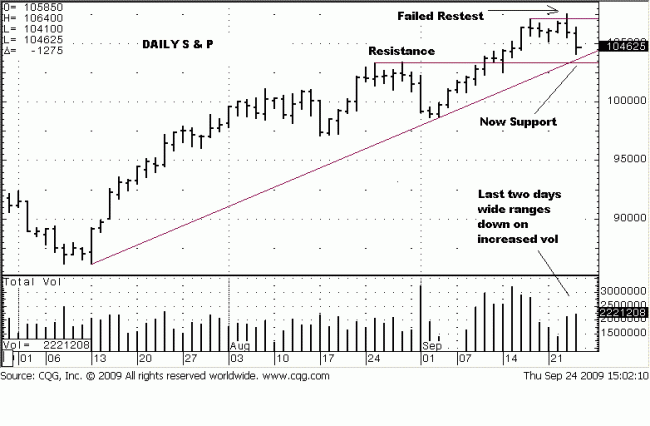
The high volume from the previous weeks had already set the stage, as we
described above. We noted how low the volume was as price was in new high
ground, a red flag, a sign of a lack of demand when demand was supposed to be
in control. Note how volume picked up once price failed at the high on
Wednesday and followed through on Thursday. This observable “fact” tells us that supply was making a run against weak-handed buyers, and the sellers were clearly winning. The speed and size of the last two days also tells us that lower prices are likely.
We do not know where support will come in. Previous resistance from late August
should now act as support in late September, the 1032 area. There are a few
other support areas, but we have to see how the market behaves, either by
continued wide ranges and high volume, or by volume abating and the ranges
getting smaller, telling us that selling is slowing, and possibly demand coming
back in. All we can do is judge the present tense market activity as our best and
most relaible guide.
If the next rally shows signs of weakness and fails at some specific levels of
resistance, new short positions would be warranted. We continue to watch
developing market activity as a guide for decision-making.


