
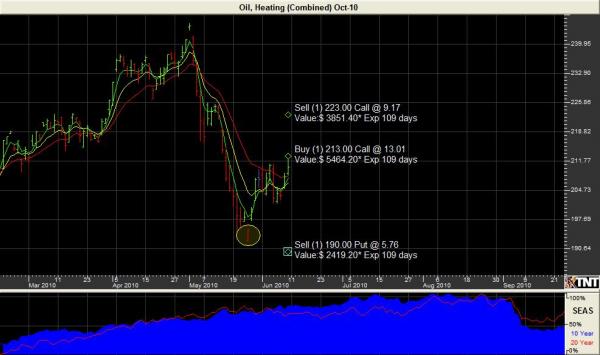
6-11 October Heating Oil has a seasonal tendency to trade higher from early July through Labor Day (first week of September) due to the industry inventory accumulation cycle. In other words the heating oil distributors are gearing up for the heating oil season, better known as winter. We are looking at the key island reversal that occurred in May, due to technical indications we are moving up our normal entry date by several weeks and like the following TWO trades.
Trade #1 October Bull Call Spread with a Naked Leg- Buy the October 213/223 Bull Call Spread and sell the October 190 put as a Naked Leg. The trade is being filled at a 3 cent credit or over $1,200. The risk on the trade based upon the credit is under187 where the risk is unlimited, between 190 and 213 you would be profitable on expiration by the premium collected, above 223 you would add an additional $4,000 to your profit.
Trade # 2 is an Iron Butterfly- Buy the October 213 and 233 calls and sell 2 of the 223 calls. The risk on this trade is limited to the premium paid which is around $600 plus 4 commissions. The profit potential is limited to 10 cents minus premium and commission paid. If you allow 2 cents (way more than enough) for costs you would have a profit zone from 215 up to 231 with the maximum intrinsic value being seen at 223, every penny above that point would decrease the profit by $400. Above or below the profit zone would result in a loss however the risk is limited to your cost.

There is a substantial risk of loss in trading futures and options
Past performance is not indicative of future results.
The information and data in this report were obtained from sources considered reliable. Their accuracy or completeness is not guaranteed and the giving of the same is not to be deemed as an offer or solicitation on our part with respect to the sale or purchase of any securities or commodities Any decision to purchase or sell as a result of the opinions expressed in this report will be the full responsibility of the person authorizing such transaction.
FOR CUSTOMERS TRADING OPTIONS, THESE FUTURES CHARTS ARE PRESENTED FOR INFORMATIONAL PURPOSES ONLY. THEY AREINTENDED TO SHOW HOW INVESTING IN OPTIONS CAN DEPEND ON THE UNDERLYING FUTURES PRICES; SPECIFICALLY, WHETHER OR NOT AN OPTION PURCHASER IS BUYING AN IN-THE-MONEY, AT-THE-MONEY,OR OUT-OF-THE-MONEY OPTION. FURTHERMORE, THE PURCHASERWILL BE ABLE TO DETERMINE WHETHER OR NOT TO EXERCISE HISRIGHT ON AN OPTION DEPENDING ON HOW THE OPTION’S STRIKEPRICE COMPARES TO THE UNDERLYING FUTURE’S PRICE. THE FUTURES CHARTS ARE NOT INTENDED TO IMPLY THAT OPTION PRICESMOVE IN TANDEM WITH FUTURES PRICES. IN FACT, OPTION PRICES MAY ONLY MOVE A FRACTION OF THE PRICE MOVE IN THE UNDERLYINGFUTURES. IN SOME CASES, THE OPTION MAY NOT MOVE AT ALL OR EVEN MOVE IN THE OPPOSITE DIRECTION OF THE UNDERLYING FUTURES CONTRACT.
Paul Brittain
Whitehall Investment Management Las Vegas
Email: paul@binvstgrp.com
Phone 877 270 8403, 702 463 0718

