
Courtesy of Sabrient Systems and Gradient Analytics
 Bulls have refused to let the market break down. Last week, the ECB’s Mario Draghi came to the rescue by pledging to do “whatever it takes” to support the euro, which launched a big rally to close the week. Still, investors have been eagerly anticipating an announcement of something more concrete, like some bold new action from the central banks, i.e., more global liquidity. After all, it has been such stimulus that has driven all periods of market strength since the March 2009 V-bottom.
The FOMC on Wednesday provided no comments regarding a QE3, and there was some mild disappointment. So, next up are the ECB and Bank of England. This reminds me that the next edition of The MacroReport will be released imminently by Sabrient, this time focusing on Central Banks. Also, be sure to visit MacroReport Interactive while it is still available at no charge. The information can help you position a portfolio for various macroeconomic scenarios, with lists of “Quick Response” U.S. stocks that tend to thrive, as well as stocks to avoid, in a given macro-variable trend:
http://www.sabrient.com/macroreport/QuickResponse-Portfolios/overview.php
SPY closed Wednesday at 137.59, after bouncing last week from the convergence of the bottom of the bullish rising channel, the 50-day simple moving average, and a previous support level at 134. It also broke convincingly above the upper line of the neutral symmetrical triangle and remains above both the 50-day and 100-day simple moving averages and firmly in the middle of its rising channel. It’s all nicely bullish, but in need of more volume.
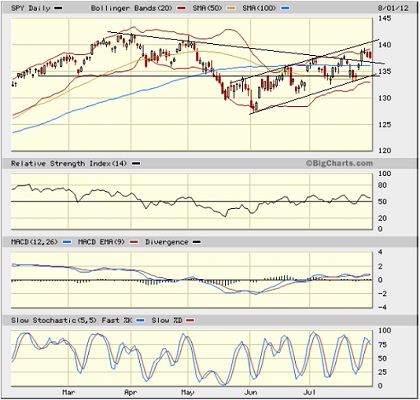
The VIX (CBOE Market Volatility Index–a.k.a. “fear gauge”) closed Wednesday at 18.96, which is comfortably below the 20 level, although it touched slightly above 20 on Monday. No discernible fear expressed here.
Worth mentioning, however, is that the late July rally was led by defensive sectors like Utilities, Consumer Staples and Healthcare, which is admittedly a bit concerning.
Latest rankings: The table ranks each of the ten U.S. industrial sector iShares (ETFs) by Sabrient’s proprietary Outlook Score, which employs a forward-looking, fundamentals-based, quantitative algorithm to create a bottom-up composite profile of the constituent stocks within the ETF. In addition, the table also shows Sabrient’s proprietary Bull Score and Bear Score for each ETF.
High Bull score indicates that stocks within…

