A weekly chart of the S&P 500 itself does not show the inverse of what the inverse S&P 500 ETF shows.
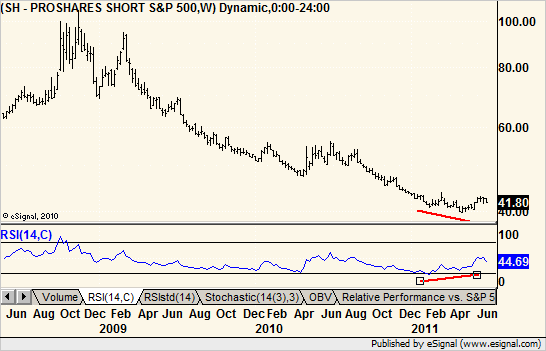
I see a bullish divergence in weekly 14-bar RSI. If the March high is taken out…..

A weekly chart of the S&P 500 itself does not show the inverse of what the inverse S&P 500 ETF shows.
I see a bullish divergence in weekly 14-bar RSI. If the March high is taken out…..

