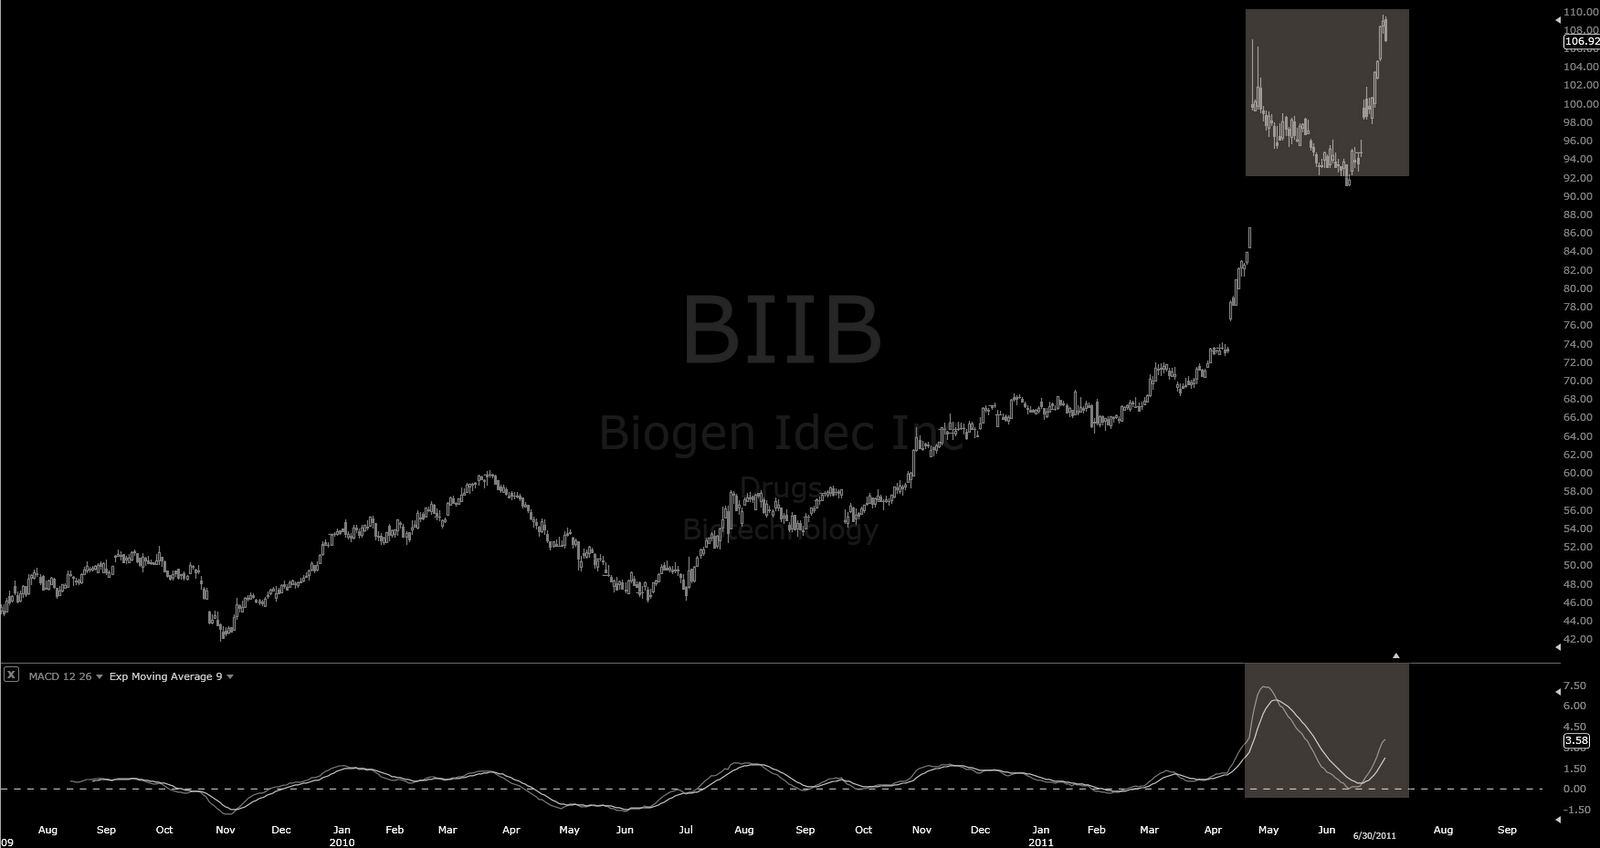
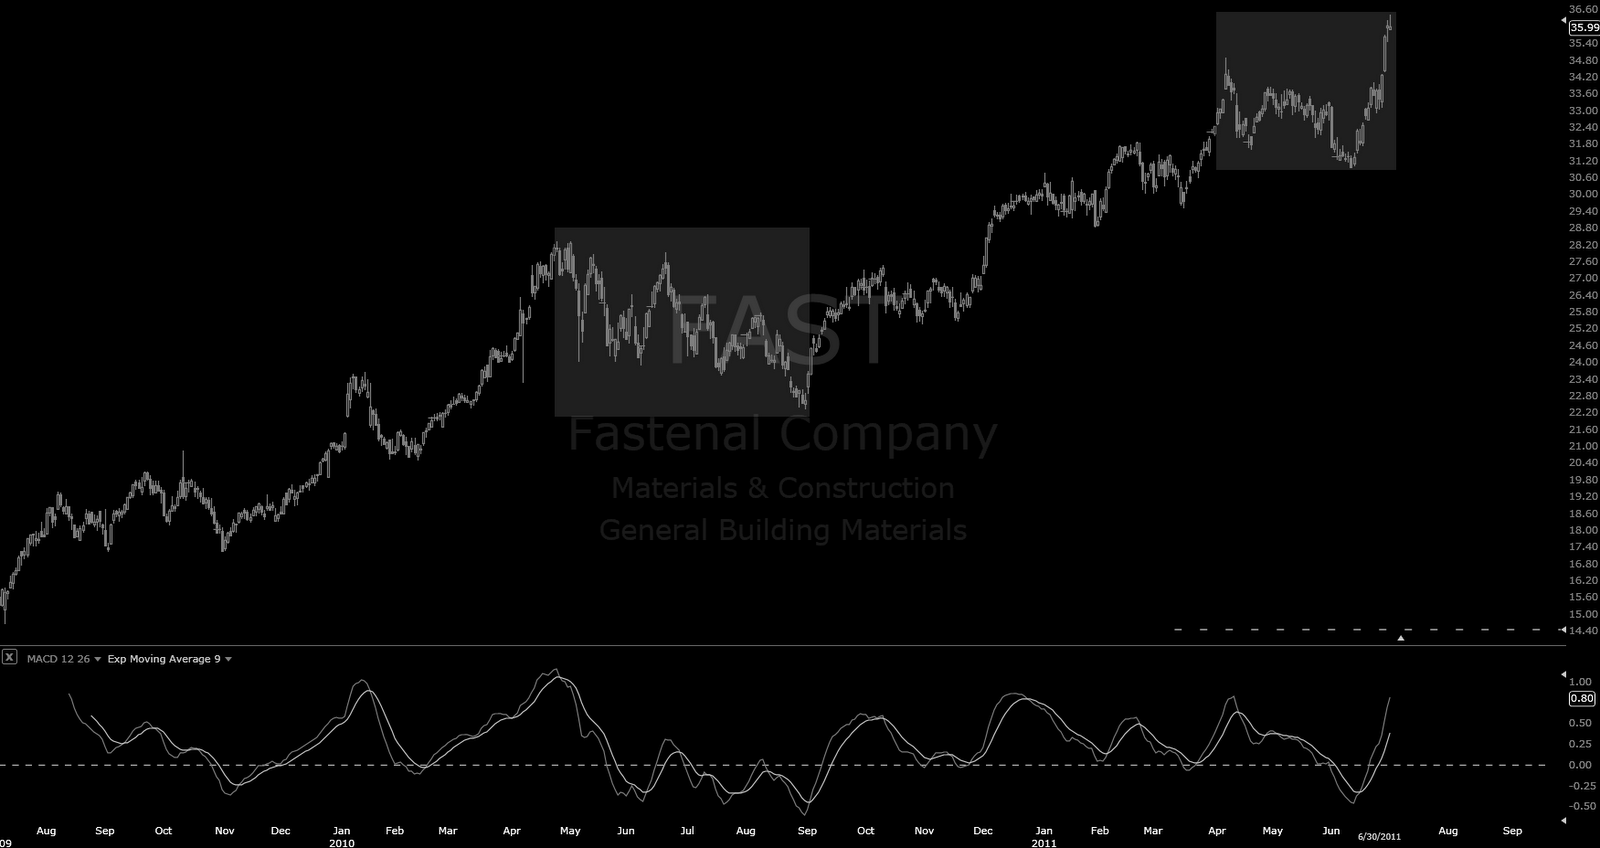
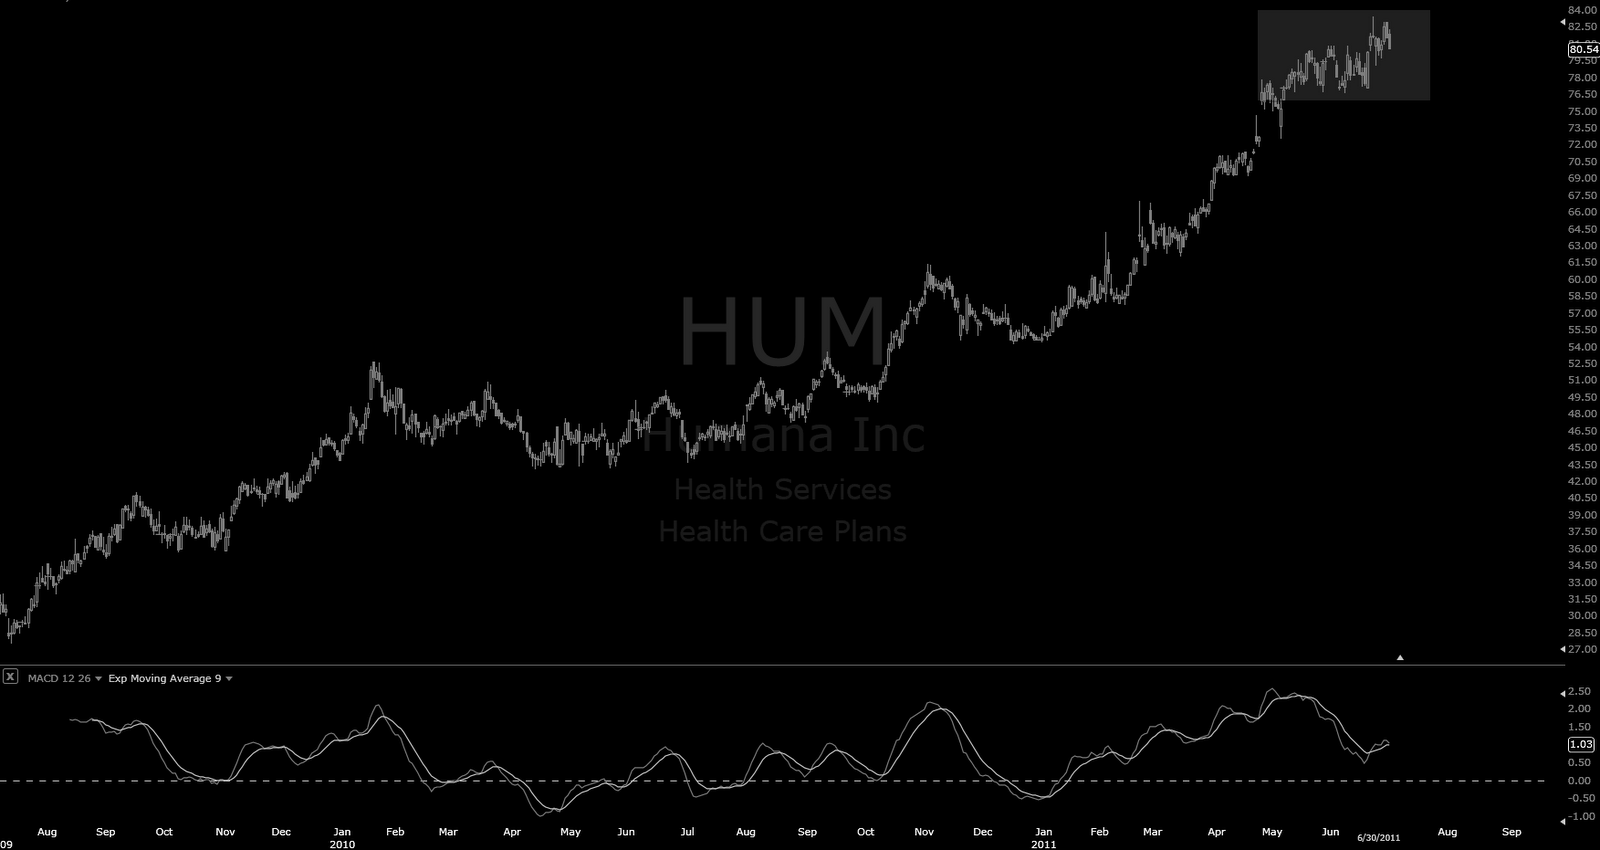
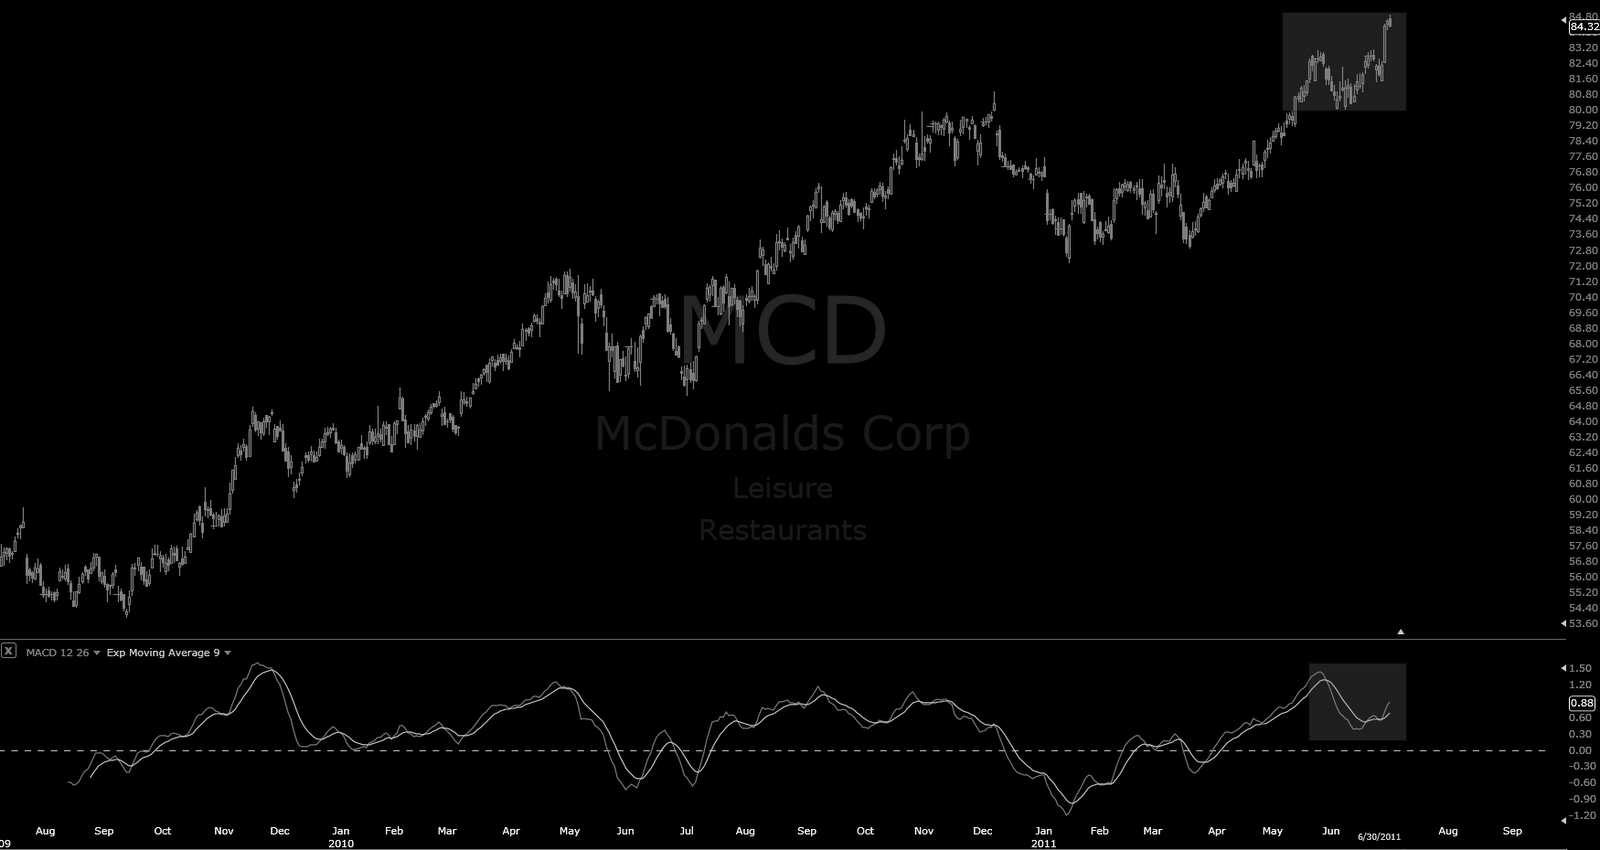
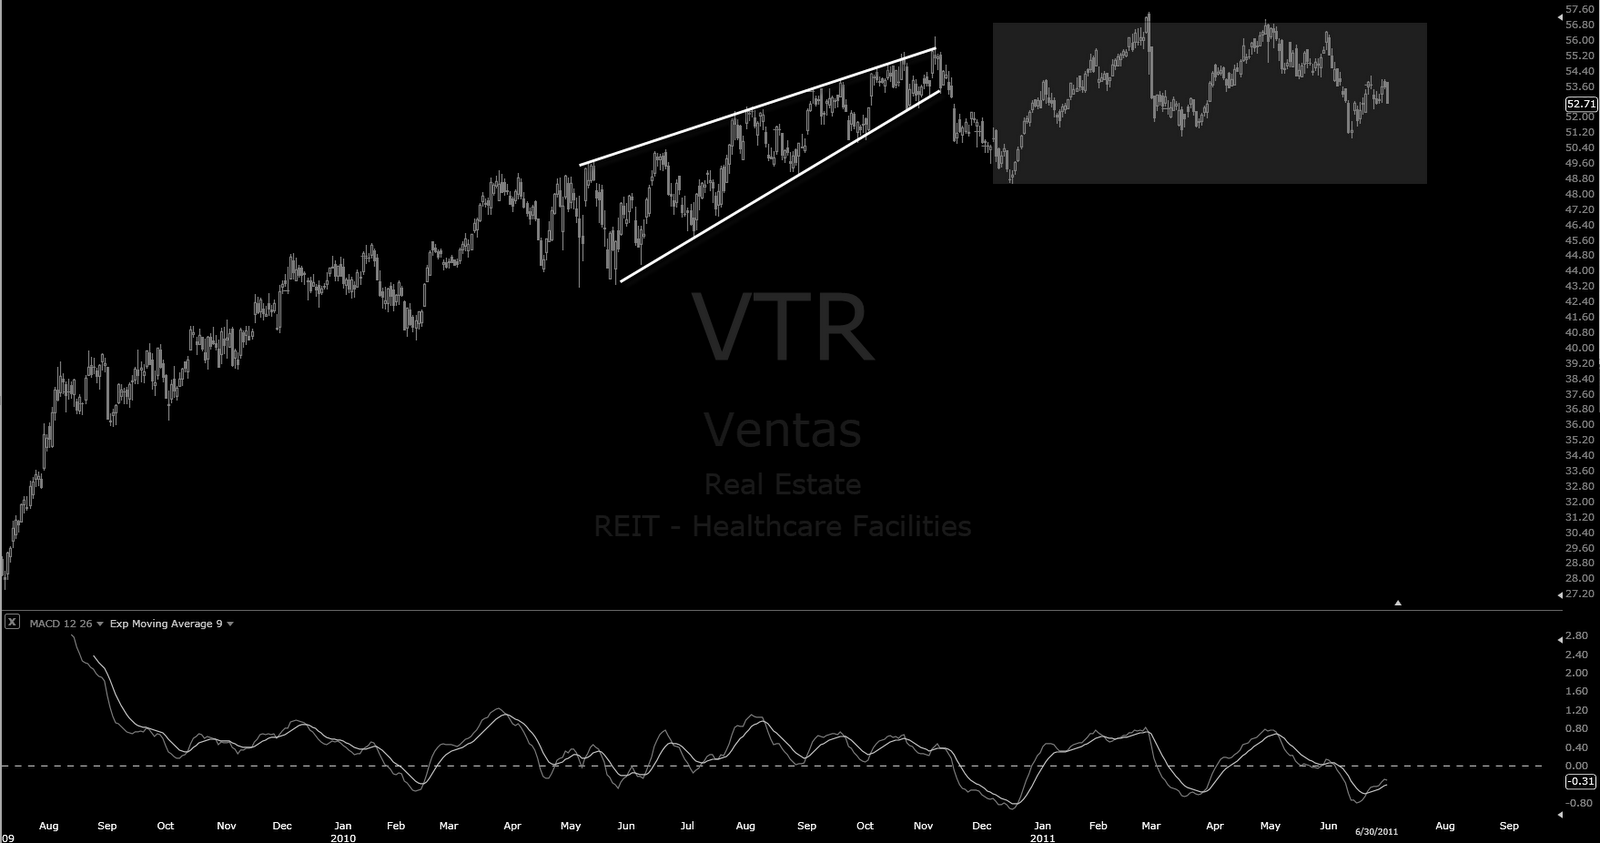
I see them little toppy or too bought, not necessary anything dramatic.
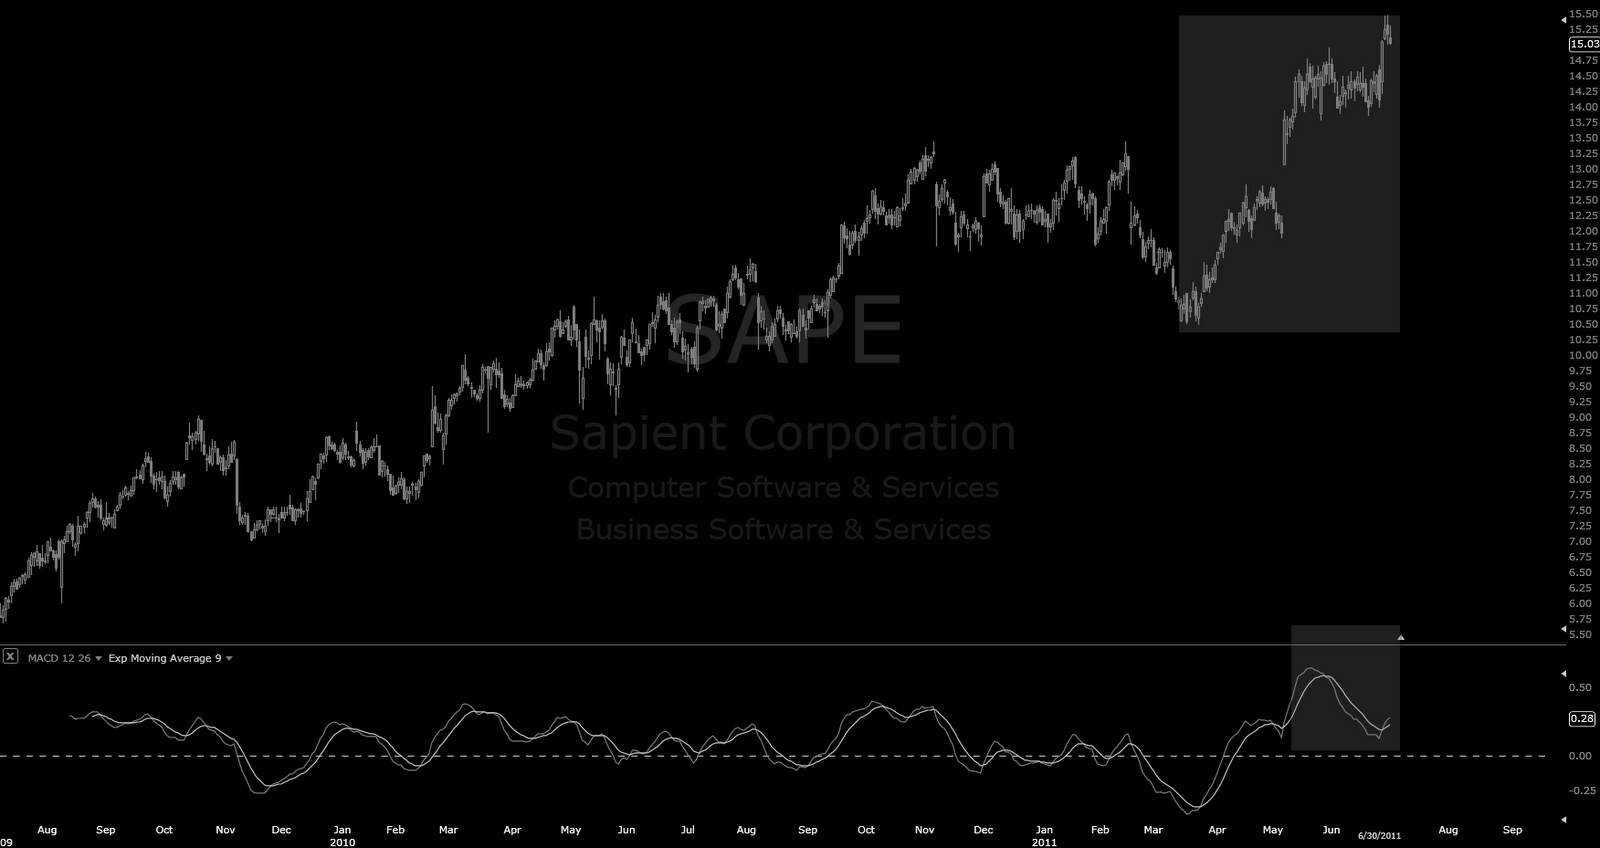
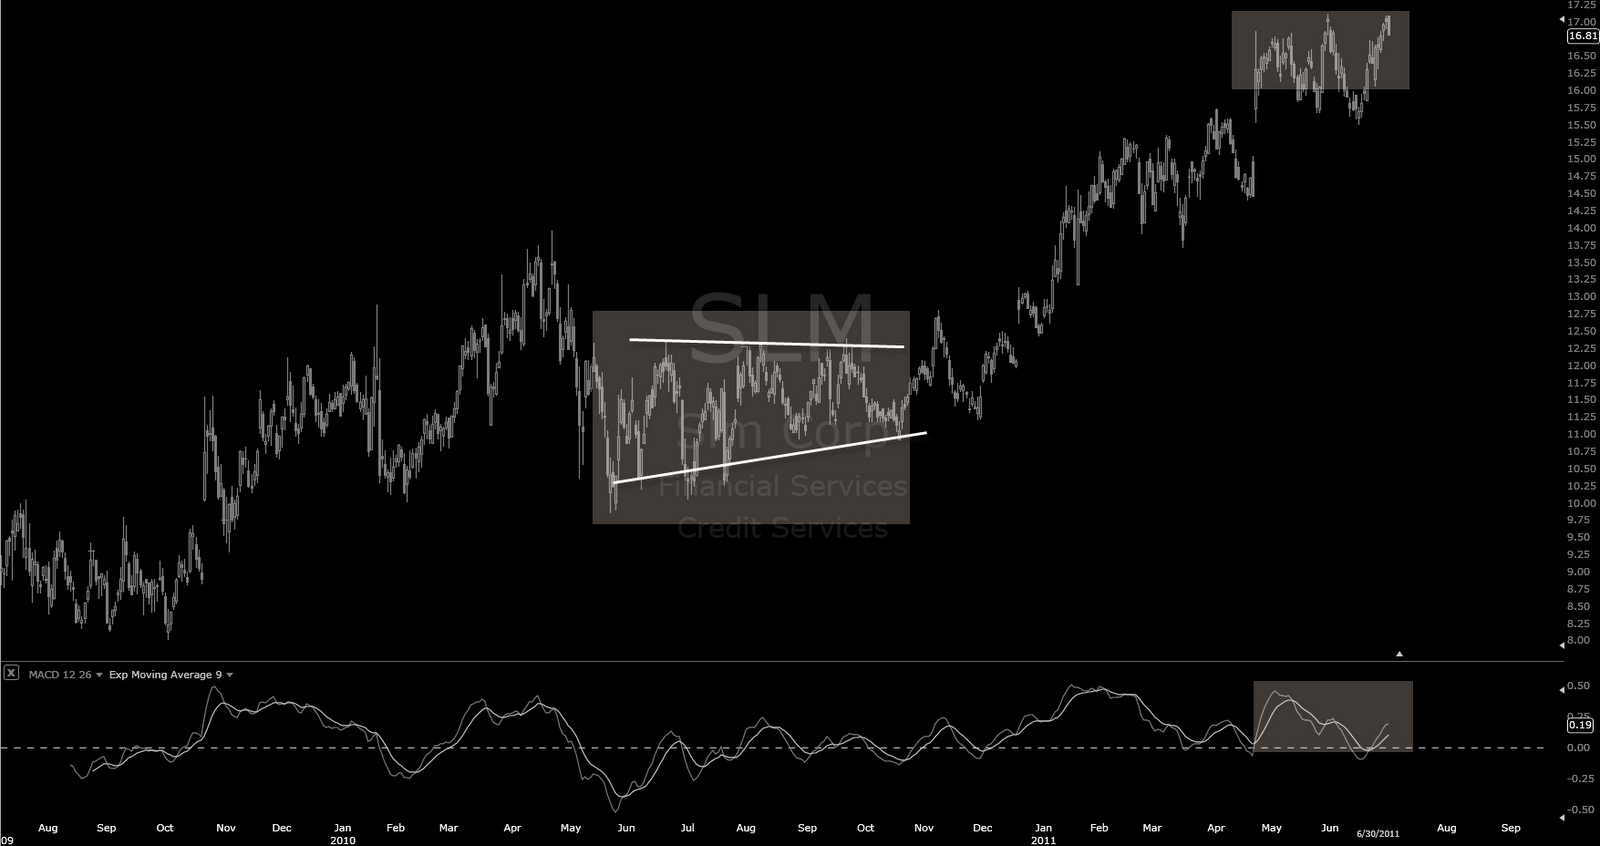
Middle highlighted areas are cont. triangles with potential W4.
Actually I see so good corrective zigzag pattern all over which are bullish I would like to buy that decided to post some bear setups and one of the major reason for bullish view is also those FX W4 contracting triangles. If you missed the bottom, wait next W2 for them, next after that is of cource W3 of W5 possibility which we might have in hands for august and that makes things very exiting also. Gartley is one possible bullish W2 pattern they can take.
These all stocks are from SPX500 index. Perhaps nothing so dramatic but little too parabolic.
For instance I see impulse done for that SLM once counting it after W4 cont. triangle – I see potential actual top for it for now which might need ABC pause. Same goes for SAPE.
We might run for that 1325 for this week but these components starts to suggest pause soon, perhaps for next week allready.