

Most of the time, traders think in terms of an Uptrending Market or a Downtrending Market. They think of the Bull Market as going up, or the Bear Market as going down.
However there is a third trend which tends to give Technical and Retail Traders the most difficulty, and that is the Sideways Trending Market.
Looking at any major index on a weekly or monthly chart view, the dominance of the Sideways Trend is obvious. In fact based on empirical chart evidence, the Stock Market moves sideways more than it does up or down combined.
Therefore learning how to trade Sideways Trends of the Stock Market is crucial to trading successfully, regardless of the trade time duration. Day Traders, Swing Traders, Position Traders, and Long-Term Investors must learn how to read the sideways trend, as well as learn how to determine whether the sideways price action will move up or down at its conclusion.
Here is a list of tips and explanations on Sideways Trends of the Stock Market:
- A sideways trend is a resting or pause in the up or downtrend regardless of whether it forms on the Short-Term, Intermediate-Term, or Long-Term Trend.
- They have variable widths depending upon the Market Conditions that create them.
- The duration is dependent upon the amplitude of the sideways trend, what Market Conditions are present at that time, and why the market shifted sideways.
- Not only is the amplitude important, but also how the highs and lows form. The high/low formation is commonly called a “range,” and it is important if it is consistent in the high/low price or if that varies.
- Within a sideways trend the analysis of runs up or down, helps determine the direction the stock or market will move upon its conclusion.
- Compression of a sideways trend is commonly the signal that the action is about to conclude.
- Volume indicators play a primary role in determining when price will shift back to an up or downtrend.
- Anomalies and variations of a sideways trend are often High Frequency Traders HFTs, which temporarily distort or alter the pattern.
- Different Market Participant Groups controlling price during a sideways trend shape and define how the sideways action behaves.
- Of the 6 Primary Market Conditions, there are 4 Sideways Trends of the Stock Market.
- Amplitude of a sideways trend can be as tight as a Consolidation or as wide as a Trading Range.
- The consistency of a price range pattern weakens, the wider a range becomes. The common term for this is Volatility.
The chart example of the S&P500 below with a Weekly View shows sideways action occurs constantly within a Bull Market, even within an Intermediate-Term Correction.
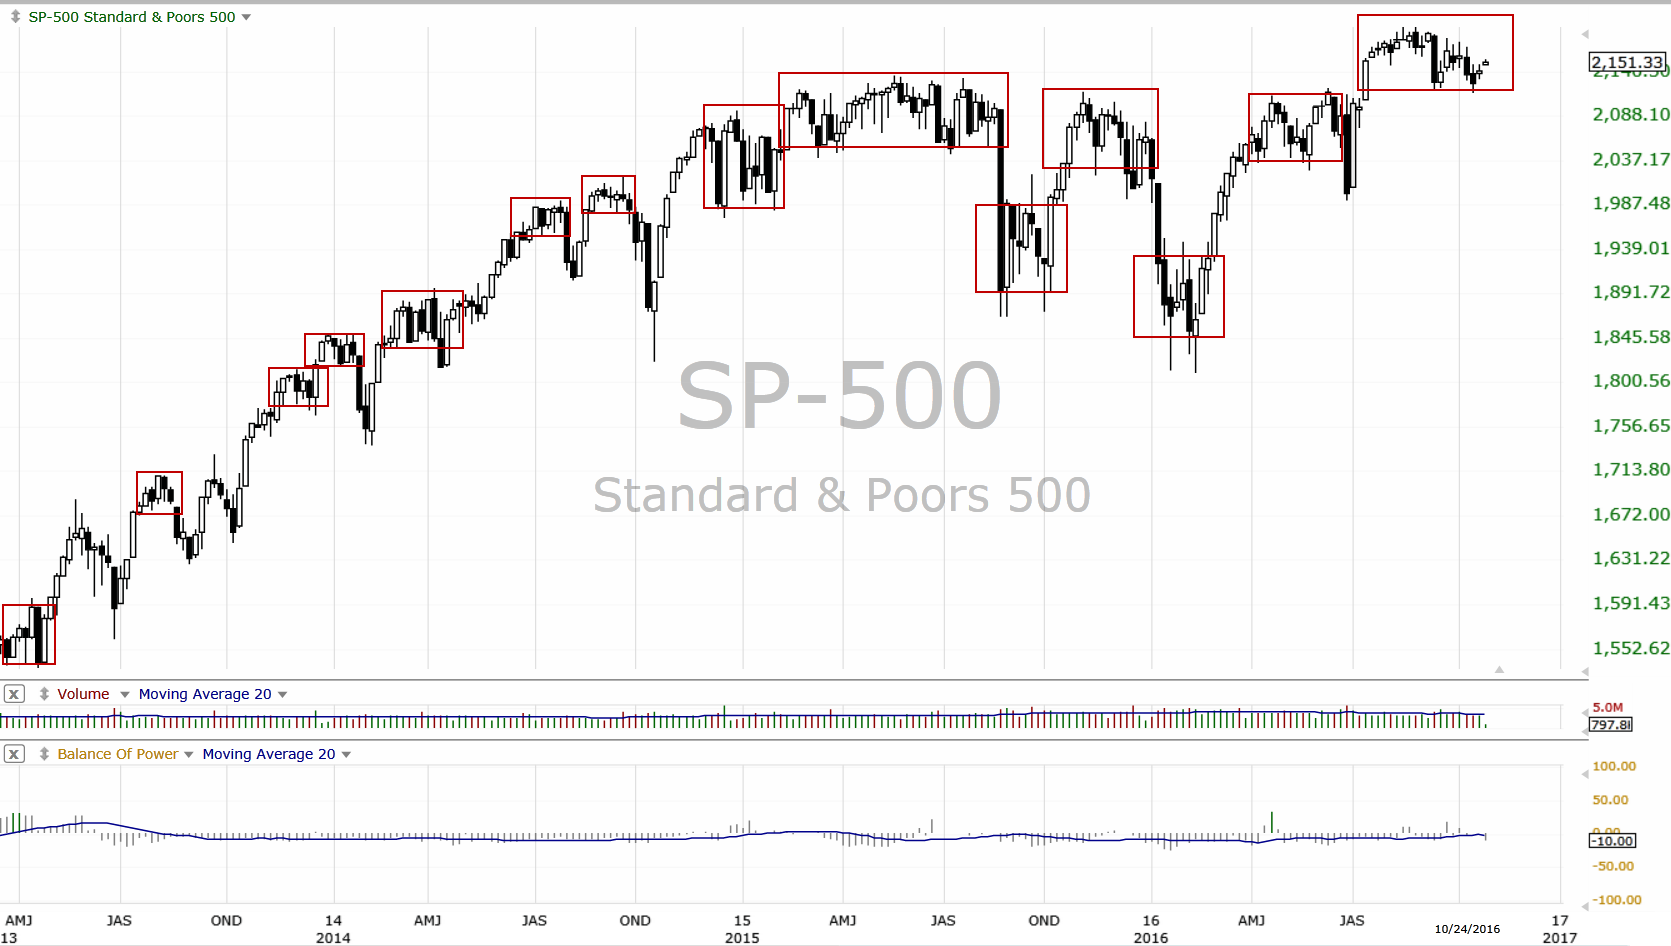
Sideways action forms at tops, bottoms, new highs, or new lows. It forms when the market is indecisive, and when sentiment is negative in a Bull Market. It also forms when businesses have lackluster Earnings Reports. Sideways patterns can last for months.
The first step to trading Sideways Trends of the Stock Market successfully is to understand why it occurred, which Market Participant Group controls it, whether it is a top, bottom, continuation of the prior up or downtrend, or merely a resting phase during a speculative or panic selling mode market.
Summary
Sideways trends are the least understood of all the 3 trends. Most traders do not recognize the various sideways trends, and do not know the direction the stock or market will move after it ends. Sideways trends are always a phase, and conclude with either an uptrend or a downtrend.
Trade Wisely,
Martha Stokes CMT
TechniTrader technical analysis using TC2000 charts, courtesy of Worden Bros. Inc.
Disclaimer: All statements are the opinions of TechniTrader, its instructors and/or employees, and are not to be construed as anything more than an opinion. TechniTrader is not a broker or an investment advisor; it is strictly an educational service. There is risk in trading financial assets and derivatives. Due diligence is required for any investment. It should not be assumed that the methods or techniques presented cannot result in losses. Examples presented are for educational purposes only.

