Friday 19 february 2010
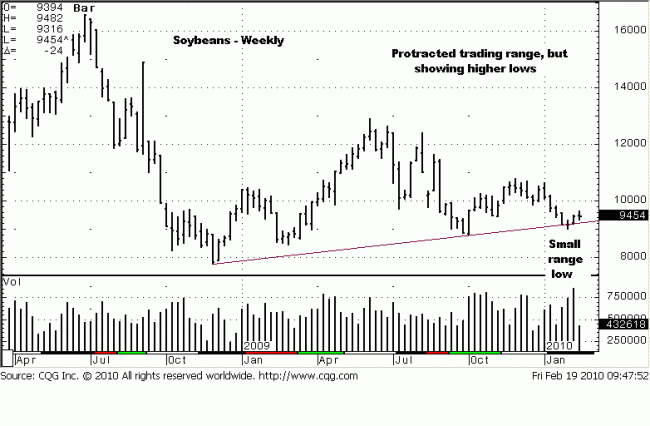
Starting with the weekly chart, it is apparent that we are seeing higher lows
since the decline from 1663 to the December lows of 2008. We do not favor
the use of trendlines, only because they are overused by so many, and there
are other, more reliable lines to draw. As a broad indicator, we are seeing this
one continues to be respected. What makes it more interesting is the small
range bar, three weeks ago. It penetrated the trendline, but held, and it
closed mid-range. That is a positive response, the HOW a potential support
area is addressed.
The mid-range close says the battle between buyers and sellers was a draw.
However, one would think that sellers should have been in total control, but
lost it at that critical point. Volume also increased. This can be a transfer of
risk from weak sellers into strong buyers. That interpretation remains to be
seen. The farther along price moves on the right hand side of a trading range,
the closer is comes to a resolve. The higher lows mentioned provides a small
clue.
Could this be a turning point?

Fundamentalists remain bearish. We can only read what the charts say. We
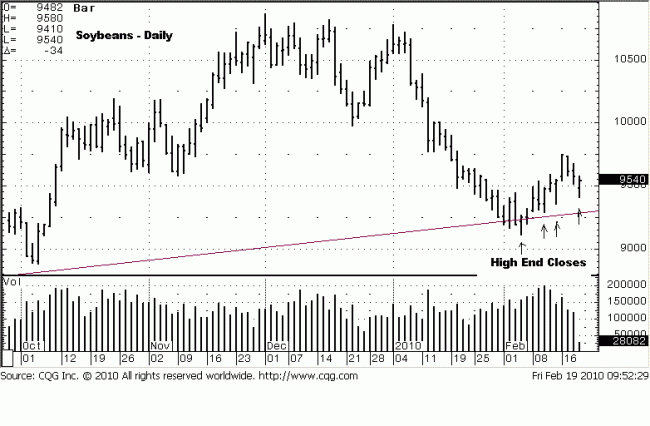
now look at the next lower time frame, a daily chart. We have noted how there
have been several high end close bars since the 4 February low. This suggests
buyers at these lower levels, or else the closes would be on the bottom of the
bars, indicating sellers in control.
We also note the three bars prior to the February low. The third bar to the left
of the low closed low end at 920. The next bar was and Outside Key Reversal
bar, [OKR], usually an indication of a turnaround of some kind. The first bar
to the left of the low is a wide range bar down with a low end close. We should
expect more downside follow-through.
What happened?
The 4 February low was a small range bar that closed high end. This tells us
that buyers absorbed all the sellers and were able to rally price by the close.
Since, you can see how price activity has turned more favorably positive.
Today’s low, as we write during the first hour of trade, shows that price held a
half-way correction. When price can hold a 50% area, it is viewed as a sign of
strength.
Not shown is the first 15 minute bar. It was a wide range bar up that closed
strongly, around 954, after holding the 50% retracement, also on strong
volume, and it was enough to put us on the long side at that price level.
Price could turn negative by the close, but we are going with developing
market activity as descibed up to this point.
Most of the rally activity is surely short-covering, but there has been some
new buying coming in, as well, based on how the bars are devloping. We
could be wrong. We could be too early. That is what stops are for. We could
also be right in identifying a potential turning point, and when such a point can
be identified, taking a position close to the “danger point” tends to be lower
risk. Beans have been acting relatively stronger than wheat and corn, so we
are going with the relative strength.
Time will tell.


