
The SP500 is currently in the midst of its largest bull trend correction since the December 07, 2011 to December 19, 2011 correction. Once the significant decline has reared its head, there becomes no lack of fundamentals in the news in an attempt to put rhyme and reason to why this is happening at this time.
As a technical analyst, the reasons WHY are less important than anticipating WHEN such situations are likely to occur. Whether it be war or drought, earthquake or floods, once the move has occurred it has occurred and that is that. Could this move have been anticipated with enough time to take action to protect investments based on the mathematics, or perhaps simple patterns?
On March 2nd, the SP500 made top at 1376.90. This follows the very top made on February 29th at 1377. Most chartist at this point should see the potential following the close of March 2nd of a double-top. However, that alone is not enough to warrant bailing dialing up the broker to liquidate equity positions, put on protective hedges, or reversing futures positions. But the data that I am going to share with you in this commentary was indeed enough to set off alarm bells, for which was set off as can be seen in this YouTube video that was uploaded on March 2nd called “SP500 MARKET TOP IMPENDING – AT CRITICAL PRICE”. Let us now consider the data that led to this conclusion prior to this recent significant market correction.
It all starts with the long-term viewpoint, the MONTHLY time-frame. The SP500 has been on a significant bull wave run since putting in a major bottom last October. As this trend continued to even higher prices in February, it became evident that the SP500 had reached a time where some sort of MONTHLY correction was due if not overdue. Why would one come to this conclusion? History.
Last year the SP500 made a MONTHLY top in February and corrected into March. The previous year (2010) it made a MONTHLY top in January and corrected into February. In 2009, it again made a major top in January and corrected into March. In 2008 it made a major bottom in January that resulted in a significant rally, before topping in February. This simple observation of history where corrections tend to occur starting January or February, coupled with the fact that no top and correction had yet occurred for 2012 as the last day of February came around, shouted volumes that one was highly likely going to begin.
To support this expectation, mathematics comes into play. Taking into account the range from the major monthly top made in March 2000 to the major bottom in October 2002 and applying simple Fibonacci retracement ratios to this range, we find that the major MONTHLY tops in the SP500 of October 2007, May 2008 and April 2010 occurred at the 78%, 62% and 38% levels respectively. When February 29th closed with a high of 1377, it was in that 62% range again, setting off another alarm bell.
Getting more specific to the 1377 price is that this price level was pre-calculated as can be evidenced by content found in that video mentioned earlier. As early as mid-February, 1377 was actually listed as the first of 3 major price levels to watch for possible major top. Several methods were employed to arrive at this conclusion, but I will mention a couple here for your enlightenment. One mathematical technique is drawn from the studies of W. D. Gann. By taking the low of October 2011 and calculating for 90-degree resistance levels, the 3rd level up (270-degrees approximately) brings us to the current top price level. Another alarm bell.
As a response to the video and an email alert that I sent out on March 2nd of the impending top, a reader responded with some very interesting information to further support this conclusion. Carefully note the following data.
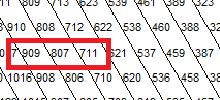
From the October 2002 major bottom to the October 2007 major top in the SPX, we arrive at 807 points. From that October 2007 major top to the March 6th major bottom, we get 909 points. And by adding 711 points to the March 6th low, we arrive at 1377, the current top. Why are these values significant, and where did 711 points come from?
All three of these values (909, 807, 711) came from a Hexagon Chart, another esoteric mathematical calculator. The image below highlights the section of the Hex chart that led to applying 711 to the most recent major bottom.
So in conclusion, while the fundamental reasons or theories as to why a top has occurred is always interesting to consider, there will always be a mathematical reason as well that holds the potential for pre-emptive action as opposed to reactive panic.

