UPDATE: I just read the logs from chatroom today, and I played SRZ the exact opposite of the alerts in there. Tort talks about the triangle formation on the 1-minute chart for intraday shorts, and commented about that when folks were going short (when I was going long) in the middle of the day. I’ve read the posts before but it will likely take a couple times for it to sink in.
Lots of fun being able to paper trade again today after sitting out since last Friday. I should be able to every day the rest of the week. Also, did not join the chatroom or Twitter in an effort to focus on charts and my own analysis. I’m going to do that every other day of paper trading.
I had BEE, GNW, SRZ and NFP on my watchlist this morning, and I made plays on the first three, and the last one, I was not able to get shares to short (I flip a virtual coin – 50% chance of getting them; TOS paper money has hyper sensitive restrictions on shorting so this my work around for that).
BEE was up .60 cents in the last 1.2 days of trading, spiking and dropping at the end of the day yesterday. This stock has a 76.32% correlation to go red with the Dow red day. It did a 10/60 SMA downside cross on the five minute chart, and I entered at $1.36. Of course, it went up right after that, and my stop order was at $1.44. It didn’t get filled, so I sold it when it dropped to $1.41, happy I had saved myself a further $50 loss. And then it did what I thought it would do, it sank down to $1.12ish very quickly. Managing risk with tight stops and letting trades breath is art that I need to practice.
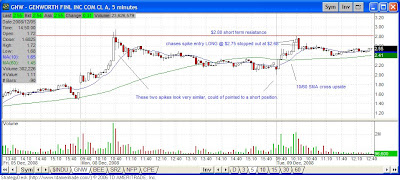
GNW was the opposite, with a 10/60 cross to the upside, but I was chasing a spiking stop that was near its short term resistance level of $2.80. This is another nuance I need to master, when to long a fast moving day ranging stock when its at a high of day, and when I should short it.
SRZ – was in someways an emotional trade based on regret. I went long at $.75 on Friday (and got stopped out right after), and it’s crazy that a day and half later, it was up to $2.60+. When I entered at $2.44, I thought it was doing a pullback like earlier in the morning when it dipped to $1.80 after hitting $2.00, and then rocketing up to $2.50. This is one I should of just left alone.
NFP, my radar stock on the right, did not complete a 10/60 SMA cross, but bounced off the 60 SMA for a new short-term higher high. It went sideways at $3.70, and it looked like it was getting weak in later morning. I flipped a virtual coin, but it came up tails – no shorts available. Literally, three minutes later, it started to sink down to $3.13ish!
My paper trading account is now in the red, but there is always tomorrow, when I will have a little more experience under my belt.


