3.12 – 2008
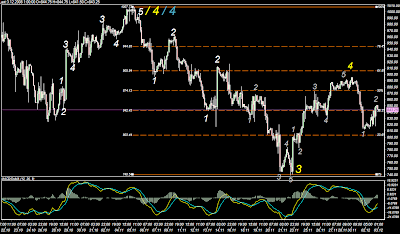
I know many expext and hope market to take snapback rally for Christmas for SPX 1000 or even to the better side as Vix gave extreme bearish signals reaching allmost one hundred. We have alternates and we could see A-B-C up wave as as scenario to fullfill IV for SPX1000, but as monday sold down relatively strongly & violently I started to gave today another look for it, after all it was just one of these same bearish HS patterns which EuroYen and EuroDollar has also recently offered quite often, but pretty strong – It argues it have to be impulse wave ?
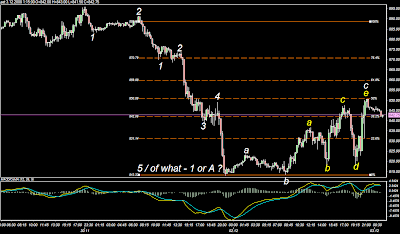
After stockmarket crashed at this monday market took then 50% correction and bought immediately when US closed, it was SPX 814. It make it twice creating doublebottom again on the next day ie. today as 817 and once again market bought it and once again it was HS pattern which dropped market to this level. Then with full impulse wave making relative strong snapback rally for SPX 850 level. More important information however was 50% level itself, because this fib retracement has been in the most strong short and long setup for this market for decades in all wave time formats starting from subminuettes all the way up.
So, here it is, if this comes true – Houston, we have a serious problem if I am right this one. Likely I will update this one tomorrow or at least before ECB will release ratecut on thursday – hopefully, FX world express more clear setup just before. All the other countries like UK and Australia cut allready 0.75 points and that´s likely what ECB will do as well, but chart might want to tell us something before that happens.
So, if you see crash tomorrow, start looking these charts – if you won´t see any crash, then you can still look at these charts and make a point > nice charts, but wrong call.
Oscilllators are however relatively neutral in all timeframes, not extreme setups or support available from there. Either the case, I feel this expanding triangle to be very interesting to see how it´s going to solve itself – you don´t see it often with SPX ! However, after waves, we have soon (again) one bearish HS as one chart below pinpoints. Timeframes with charts below are down from 2 hours to 15 minutes.
99 % of the hard pro technical folks are bullish now in this indursty, but there´s also very simple guideline of the EW theory I just created, the side which ran faster is usually correct and with this one I mean this monday plunge. Do you really think most strong downside day of the multimonth plunge is end of this when it´s not even new low – don´t know, but one need pretty good imagination if you try to fit that for B wave for example…let´s hope it´s more clear tomorrow – shall we….


