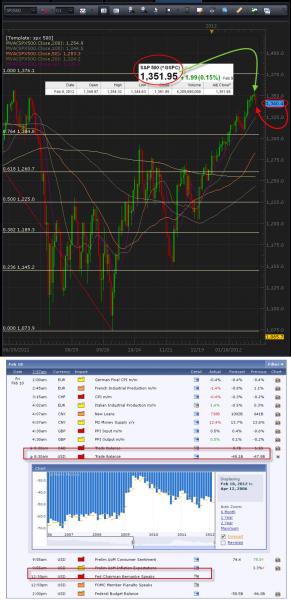
The SPX 500 sits about 10 points lower (as of 8:15am EST) from yesterday’s close on the S&P 500. The debt deal for Greece has yet to be resolved and still needs to cut additional debt. The VIX is a sign of volatility, which has been slightly rising this week. When the market declines you will see the VIX spike upwards. If you’re waiting for confirmation, the VIX can be a helpful indicator of trend sentiment.
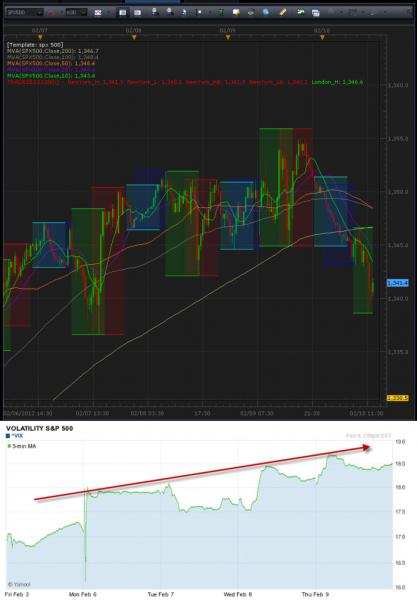
The colored SPX 500 (30 Minute) chart below represents each session and the overlap (beginning with light blue Sydney, dark blue Tokyo, green London, and red NY session). When you enter a position this will help determine that day’s high and low range. Remember it is a Friday and the scheduled Greek meetings may lead to consolidation as we head into next week.