
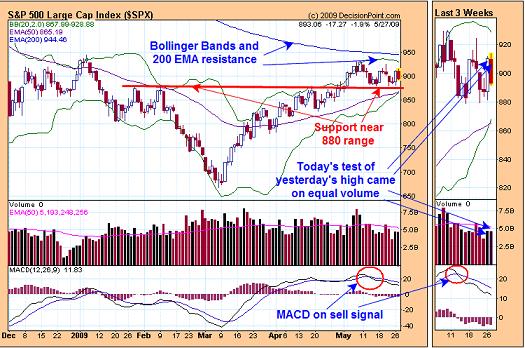
The above chart shows were support and resistance is on the SPX. Resistance lies at the upper Bollinger band (near 930) and at the 200 EMA (near 947). Support lies at the Red trend line which came from the January and February highs near 880 range. The MACD is currently on the sell signal along with a host of other momentum indicators. Short term there may be still backing and filling. Today’s rally tested yesterday’s high on equal volume and suggests yesterday’s high will be tested again. Also the May 20 (near 930) high had high volume and suggests that high needs to be tested again and if tested on lighter volume may finish off the topping process. The current volume pattern forming suggests more rally attempts to tests the recent highs. This topping process may take a few more days to complete. A close below 880 (red trend line on chart above) would imply the top is in and the downtrend has begun. We are expecting a pull back to the 740 range. We are short the SPX at 883.92.
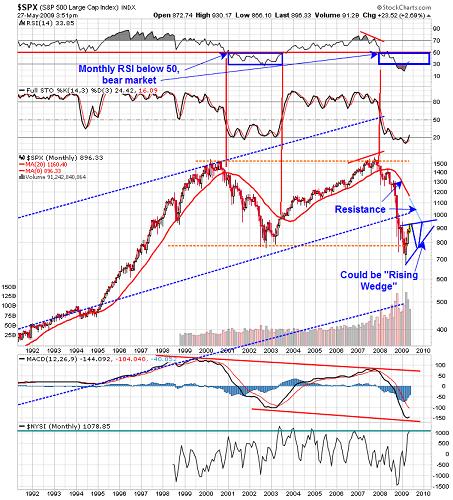
We are expecting a pull back to possible low as 740 range in the weeks to come. Above is the monthly chart of the SPX. The top window is the monthly RSI. When the monthly RSI is above 50 then a bull market conditions are present and below 50 then bear market condition are present and right now the monthly RSI is 34. The Red moving average above and below the SPX is the 20 month moving average. When the SPX is above the 20 month MA then a bull market is present and when below a bearish market is present and right now the SPX is below. Notice that in an uptrend the 20 month MA supports the market and when in a downtrend the 20 month MA show resistance. In the far right corner of this chart is what may happen in the SPX in the coming months. We are expecting a pull back to possibly near 740 (possible into July) then a rally from 740. Notice that the 20 month MA will be declining and if the SPX does rally will find resistance near 960 late this year. If rally continues through 960 with big volume, then would expect the bull market is back into control. If the SPX rallies up to 960 and volume becomes light then 960 will show resistance and the whole pattern developing form the March 09 low will from a bearish “Rising Wedge” pattern. It’s something to watch for later this year. There are a lot people suspecting the current pattern forming is a Head and Shoulder bottom and the market is about to form the Right Shoulder on the next pull back. We don’t know what pattern will develop but the “Rising Wedge” is a possibility and the volume characteristic should give us the clue whether a Head and Shoulder or Rising Wedge pattern is forming.
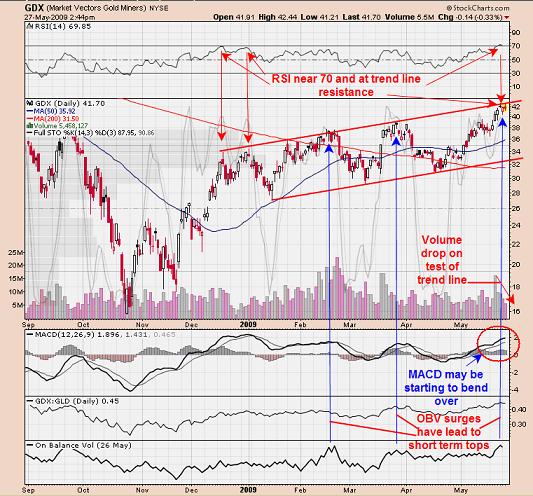
Above is the daily GDX chart. The RSI is near 70 and GDX up against Channel resistance with volume declining. Rallies are lasting if the volume gradually increases. This combination of indicators suggests the market does not have strength to push through Channel resistance. Therefore a topping pattern may be forming here. Over the last couple of days “On Balance Volume” (OBV) surged and previously when OBV surged the market was near a high. We are looking for a pull back in GDX over the next several weeks that could retrace back to the 29 area. Long GLD at 89 on 4/24/09. Long KRY at 1.82 on 2/5/08. We are long PLM at 2.77 on 1/22/08. Holding CDE (average long at 2.77 (doubled our position on 9/12/08 at 1.46, Sold 5/13/09 at 1.55=6% gain). Bought NXG at 3.26 on 6/4/07. We doubled our positions in KGC on (7/30/04) at 5.26 and we now have average price at 6.07. Long NXG average of 2.26. For examples in how “Ord-Volume” works, visit www.ord-oracle.com.

