
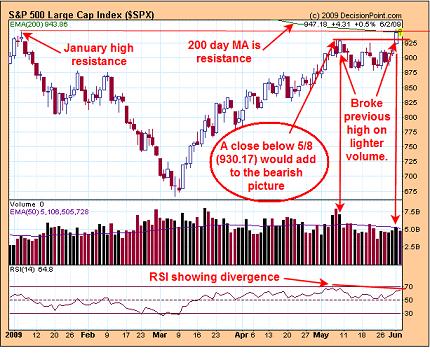
Over the last couple of days the SPX has been testing resistance levels of the 200 day moving average and the January high and doing so on decreasing volume and a bearish sign. Also the SPX jumped above the 5/8 high on 28% lighter volume and implies a false break to the upside. A close below the 5/8 (930.17) would add to the bearish picture. The RSI is showing a negative divergence also. Today’s price spread narrowed along with volume decreasing which normally precedes a move to more volatility. We are still looking for a pull back. We are short the SPX at 883.92.
We Bought ASTM at 1.92, Biotech group. Long POWR at 13.70 on 12/14/07.
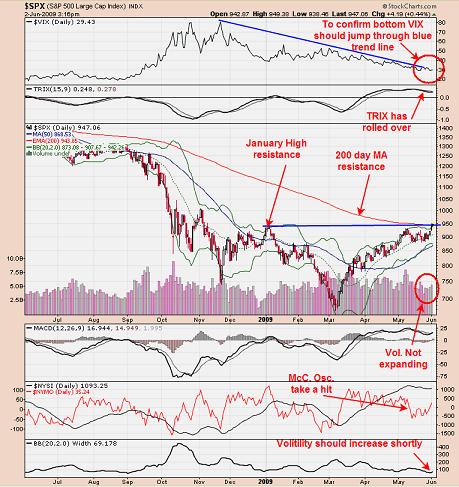
On the daily SX chart the volume is not expanding as the market is pushing at the 200 day moving average and at the January high resistance level. For these resistance to be broken, energy (Volume) should be expanding and that is not happening here. The second window from the top is the VIX. For confirmation of a top the VIX should jump up through the blue trend line. VIX is at the trend line right now but has not jumped through it yet. In Mid May the McClellan Oscillator took a hit down to -500 range and showed weakness has interred into the market. This weakness in the McClellan Oscillator is common right before a top is seen. Also notice that the Bollinger Bands are contracting and suggests volatility may pick up soon. The S&P did take a shot at the high volume days like we were expecting and do so on lighter volume which created a bearish sign. Now we would like to see a close below the high volume day of 5/8 to add to the bearish picture.
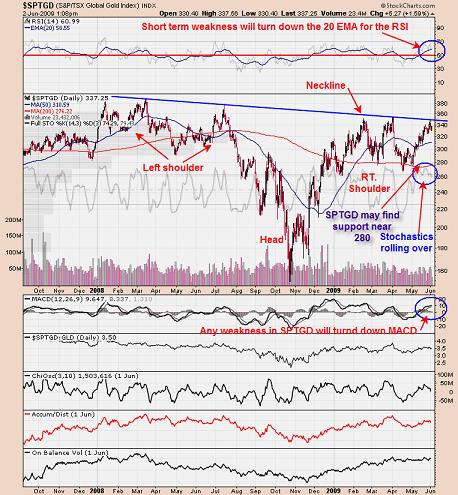
Above is the XAU gold index for the Canadian market (SPTGD). It possible Head and Shoulder bottom may be forming on SPTGD. Recently this index tested the Neckline near 350 range. The Full Stochastics has rolled over and any short term weakness will turn down the MACD as will as the 20 EMA for the RSI. If and when SPTGD pulls back, this index may find support near the previous lows of 280 range. If bullish condition develop near 280 then that may be a good place to purchase gold issues. If the pattern of the Head and Shoulder does develop it would have an upside target to 560 range which would represent a 100% move from 280. To help confirm this Head and Shoulder bottom, we would need to see a “Sign of Strength” through the Neckline at the 350 range. For now we are expecting a pull back to the 280 range and we will se what happens there. Long GLD at 89 on 4/24/09. Long KRY at 1.82 on 2/5/08. We are long PLM at 2.77 on 1/22/08. Holding CDE (average long at 2.77 (doubled our position on 9/12/08 at 1.46, Sold 5/13/09 at 1.55=6% gain). Bought NXG at 3.26 on 6/4/07. We doubled our positions in KGC on (7/30/04) at 5.26 and we now have an average price at 6.07. Long NXG average of 2.26. For examples in how “Ord-Volume” works, visit www.ord-oracle.com.

