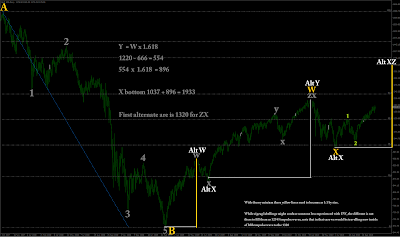
Made one SPX daily chart EW count in here.
While intermediate risk is approaching and everyone is waiting does G20 crash our dollar it is good to remember that size of waves doest much even shows in the chart like this size.
Actually it is not even bullish count, bullish would be that we placed W2 bottom on july just few months ago and we would be now inside of W3.
1.0, 1.382 and 1.618 are most typical size of W5 if compared for W (wave 1) size.
However, chart should explain also why market hasn´t do any kind of “resting ” much. It does have W3´s on the action.
What other options it potentially could have ? One would be to start building huge size of contracting triangle in this X wave position ie. going sideways for long time to come. However, it would be a bit difficult to see this strong market and earnings during the some cont. triangle B wave but I suppose in theory it is possible.
86 % of SPX instruments reported EPS so far as exceeded estimates.
While some corrective IV wave with smaller degree might be behind the door, I am extremely neutral to take any swing contraview for this reason, major degrees are major degrees and they kills shorter degree quickly.
Eur-Usd Chart have anyway now reasonable risky place and reasonable big also, it is not very ideal bearish gartley with my exprience, but that ABC itself is more than ideal and it can take reasonable correction if it wants to, theory alouds that.
Note also that if this ZX is coming real some day, it will have bearish butterfly and that will be very serious issue. Real and very ideal butterfly appears only in W5 position to end it.


