

As another week passes and U.S. stock indexes continue to make new highs, nobody can think of a reason not to be buying this market. With the seasonality on the side of the bulls, why not just jump in and enjoy the ride?
For every buyer, there must be a seller and every seller must have a buyer. There is no way around that! When there are more buyers than sellers, the indexes move higher. If there are more sellers than buyers, the indexes will move lower.
One of my favorite tools to watch for the actual “strength” of the current trend, is the up/down volume charts. There are plenty of ways to give the illusion of strength and/or weakness, but you can’t hide volume.
By tracking up/down volume, one can easily see if strength is supporting the current trend. When selling volume starts to dry up and the S&P 500 (SPX) continues lower, one would start to look for a reversal to the upside. When buying volume starts to divergence and head lower as price continues higher, one would start to look for a reversal to the downside.
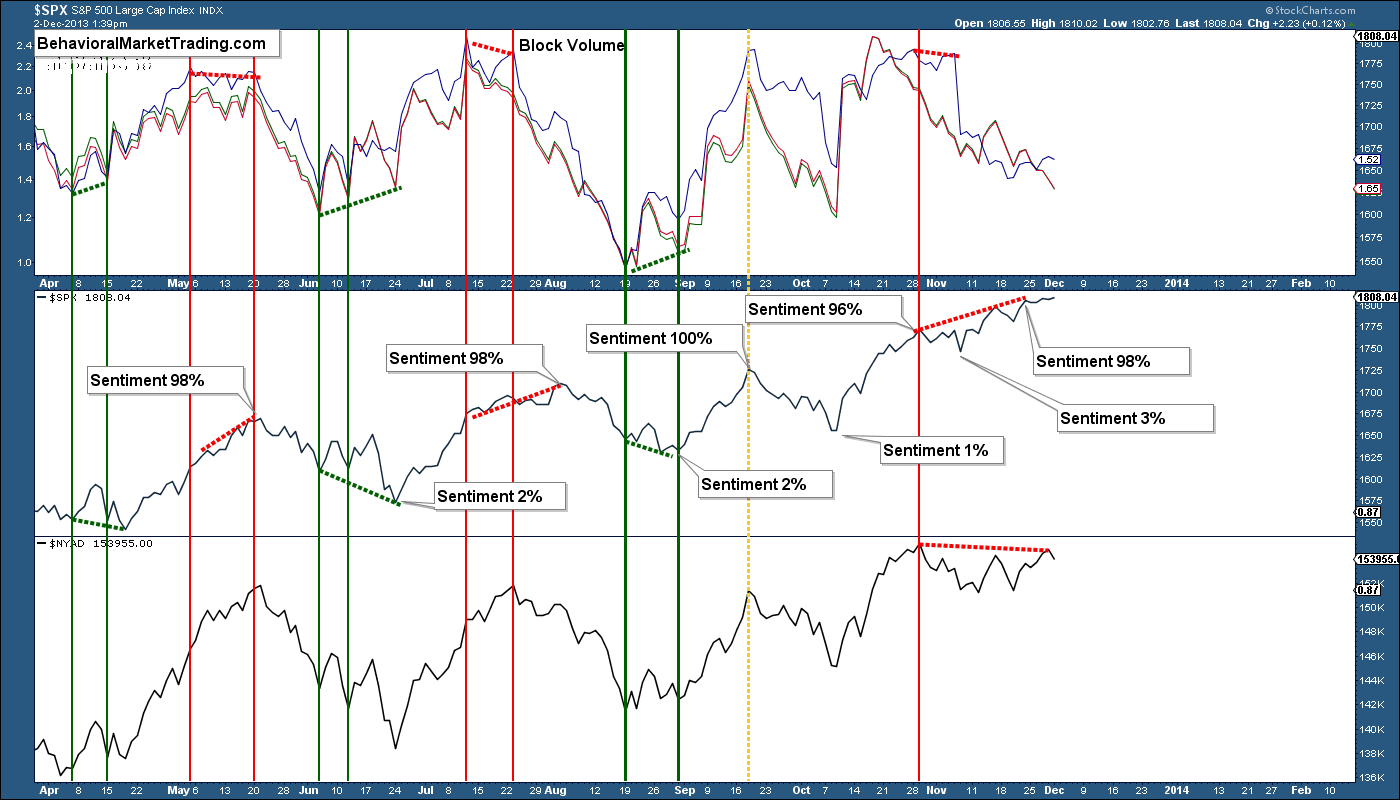
These volume divergences are NOT trade signals, but rather a warning signs. You have to use other charting methods to determine where price MAY reverse.
The 3% Bullish on November 8 at 1746 S&P is significant support. We’ve been waiting for a final spike or an overt failure before entering into a short bias. This week was allowed to “become even more tiresome and frustrating.” It has been, but is now teetering at a dangerous level of complacency, wave counts, fractal patterns and extended price trend. It’s time to get defensive!
= = =
Read our free report with three very important charts. Click Here.

