

US equities had a pretty good week. The S&P500 (SPX), the large-cap cash index, gained about 60 points or 3% for the week, made a new high for the year, and held most of the gain through Friday’s close (Feb. 6).
From a technical viewpoint, it also broke out from a descending wedge pattern, which often leads to a further advance, if not always immediately. It subsequently fell back to the break-out point, leaving us to wonder if this is a true break-out or just a head fake. We should know by the end of the week.
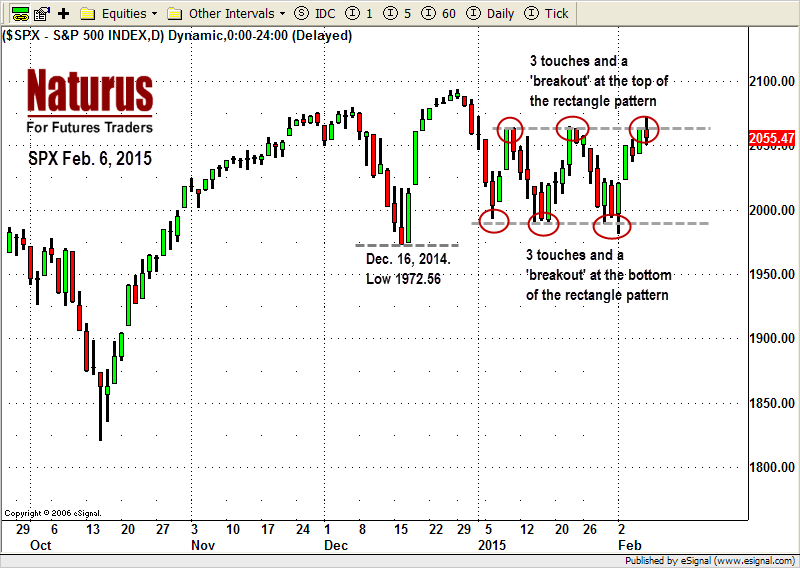
The daily chart (see below) is showing an unusual similarity at the top and the bottom of the rectangle. At the bottom, the lower bound was touched three times and made what proved to be a false break-down at the third touch. At the top, the upper boundary was touched three times and has made a “breakout.” We are still waiting to see if it is false or not.
Rectangle patterns like this are consolidation areas where the market either establishes a base for a move higher, or forms a top leading to a new trend down. This consolidation area has been forming since the beginning of the year, and it will end with the establishment of a new trend, either up or down. We are likely to see the beginnings of a new trend in the next few weeks.
We have seen this Bull market running for well over five years, and what we might be watching now is a medium term distribution behavior setting up a correction later. But it could just as easily represent a short-term accumulation behavior setting up new highs in the coming weeks and delaying the medium-term correction until at least June.
Note how many times the market has reversed at the boundaries, and remember that rectangles often have false break-outs and break-downs. Those sudden reversals are expensive.
What Happens Next
This is a light week for economic news, but Europe – Greece, Spain, Ukraine – could produce some new events that rattle the market.
If the market breaks above the overhead resistance line at 2095, the minimum upside target would be a 3-5% increase. If SPX fails to break 2095, instead breaking below 1973 line, then it is likely to start a medium-term correction.
On the SPX, we have to watch the 2040-35 zone. If it holds up, the bulls may try to push the SP500 higher again.
For the futures (ESH5), a breakout move should be expected soon. A move above 2072.50 could push ESH5 up to 2083.50-88.75 to retest last December’s high or higher up to 2099-2100.
Remaining below 2068 could lead the ESH5 to drop back into the 20/40 EMA area near 2035-2033. A close above 2068 or below 1970 will be one way to confirm if the break is real or fake.
- Support levels: 12015-16.50, 2000-1998.50, 1989-88, 1975-78.50
- Resistance levels: 2078-75, 2093.75-92.50, 2109-12.50, 2125-27.50
SPX Feb. 6, 2015. Daily Chart
#####
Naturus.com publishes a free analysis of US equity markets each Sunday. To start receiving it, click this link.

