

Last Week
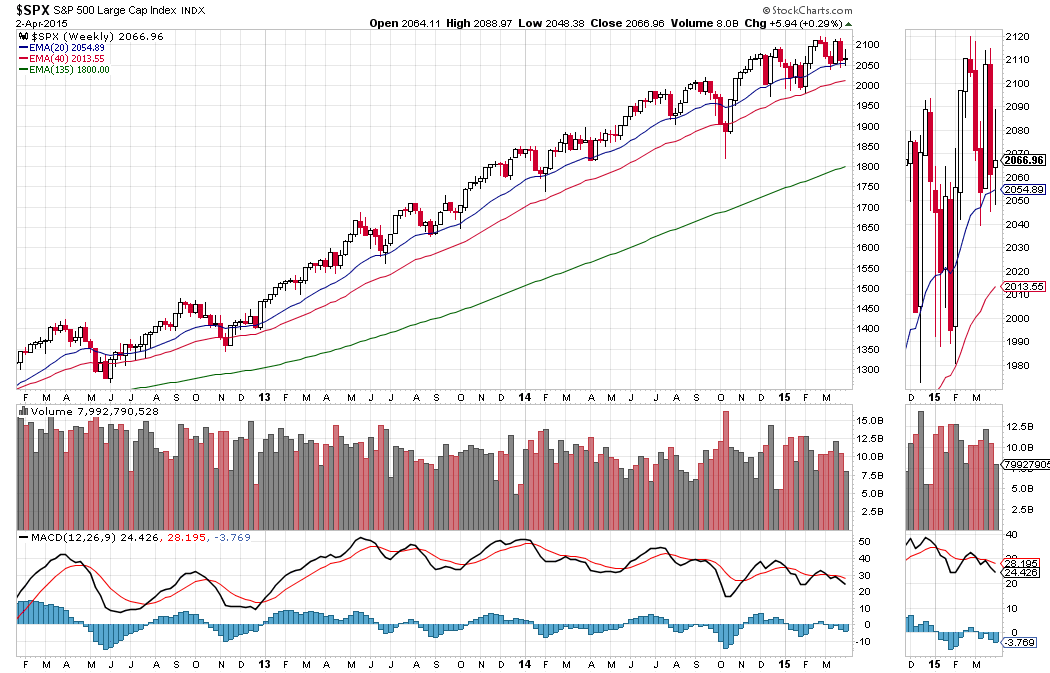
The S&P 500 cash-index ($SPX) closed at 2066.96 on Thursday (Apr. 2) up 5.94 points for a minuscule gain for the week and a slightly larger gain (about eight points) for the year. Not much to show for all the uproar and commotion.
Last week was a short week due to the Good Friday holiday, but there still was lots of volatility in the market. The SPX had a strong bounce on Monday, then sold off from its high. Thursday had a little pre-holiday bounce, but it was a minor recovery. It gives a bearish short-term outlook for this week.
The SPX had a minor retracement for March, and traveled inside February’s monthly range. For the longer-term, the outlook is still bullish and the uptrend is still intact, but we are expecting some further retracement in the short term.
The long-term indicators are becoming overbought, and we have been in a strong bull market for five and a half years. Profit-taking and/or rotation in and out of the market will likely continue in April.
This Week
This week could see more volatility. The European market is closed on Monday, and the Passover holidays continue throughout the week. The FOMC minutes will be released on Wednesday and corporate earnings season starts when Alcoa releases Q1 earnings the same day. It should be a busy week. We expect the volume will be thin on the first day of week, and increase on the following days.
The 2045-60 zone should be considered as the pivot level for the coming quarter and, perhaps, for the year. Movement above or below that level could trigger stop runs and lead the price to pop or dump, so there will be short-term choppiness. This chop-chop-chop may form a long-term, perhaps yearly, sideways range to build a base to support the next upside run.
The issue is how far this market can retrace. We could see a 10-20% retracement before we are done, followed by the next step-by-step leg up. 2075-80 will be the first resistance zone and 2036.50-31.50 will be the first support zone to watch. As long as both of them act to confine the price movement the index shouldn’t go too far away from 2055-60 in the short term.
ESM5
The S&P 500 mini-futures (ESM5) are in a short-term downtrend that is likely to continue this week. There was a minor bounce Thursday (Apr. 2) and a sharp decline in overseas markets over the holiday. We may well revisit last week’s low around 2033.50.
2068-64.50 is the current resistance zone and it needs to hold ES down until the market completes its A-B-C pattern, with the C low expected near the 2023.50-21.50 area.
The volume will probably be thin, and we could see a snap up or down in a short time-period with light volume. But as long as ES stays under 2065, the odds will favor the short side.
- Major support levels: 2031-33, 2023-21.50, 2015-12.50, 2000-1998;
- Major resistance levels: 2066.50-68.50, 2078.50-80.50, 2088.75-90.50.
SPX Weekly Chart – Apr. 2, 2015
#####
Naturus.com publishes a free weekly analysis of US equity indices. To get on the mailing list to receive it, please click here.

