For buy-and-hold investors and the legion of fund managers and brokers who depend on them for sustenance, the only good thing to say to January is “good-bye.” And good riddance.
But don’t look for any great improvement in February. We’ve already had the good times for this year, according to Bank of America. Now it starts to slide downhill.
The Wall Street superstition is that as January goes, so goes the year. That’s one reason the people who make their living by persuading you to spend good money for bad paper expend a lot of effort to generate an optimistic start.
You won’t hear much of that this year, because January was so crummy. But the thing is, it’s true. Bank of America which studies these things, tracks seasonal stock trends back to forever.
The best period of the year, hands down, is Nov. 15 to Jam. 15. Says BofA:
November-January is the strongest consecutive 3-month period of the year. During this period, the S&P 500 is up 66.7% of the time with an average return of 3.35% going back to 1929. November 2015-January 2016 is down 6.50%. The S&P 500 has not followed this bullish seasonal pattern and is on a pace to have the eighth weakest November-January going back to 1929. January 2016 is down 5% on a pace to be one of the worst January going back to 1928.
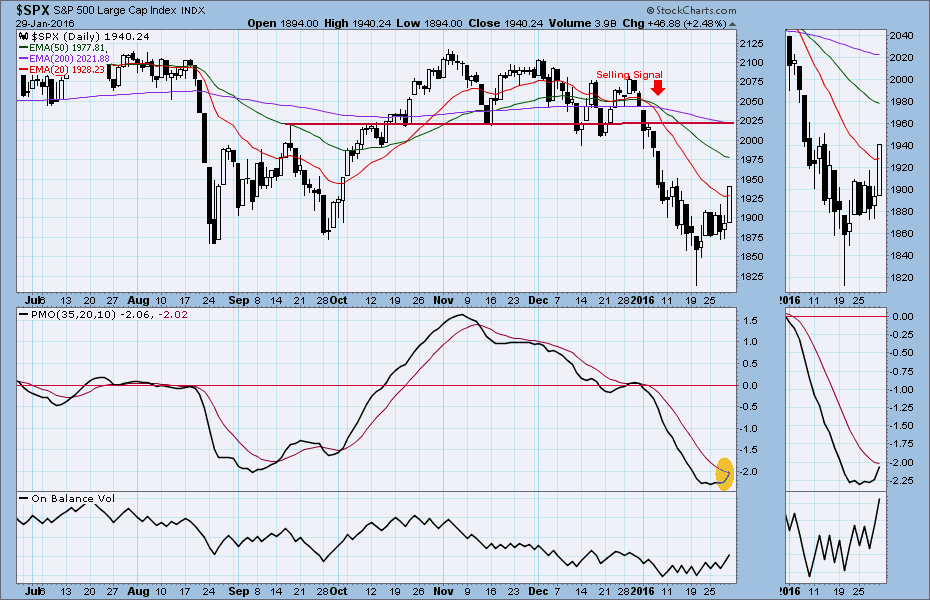
There’s not much to add to that. The large cap index has put on a determined display into the end of the month: up from a low at 1812 10 days ago to close at 1940 on the last trading day of the month — up 45 points on Friday alone.
That caused a lot of clenched jaws among the option sellers, for sure, but it doesn’t change the basic reality. The sentiment has turned and the market has entered a distribution phase, when the smart money stops accumulating financial assets and starts distributing them.
Guess who they want to “distribute” them to.
Today
The index made a good oversold bounce last week and could move higher still. The first resistance is around 1975. The major resistance is the September high around 2020.
The current support is around 1870-75. If it is broken, watch for the sellers to come swarming back in again.
For the S&P 500 mini futures (ES), they gapped up strongly Friday and closed near the top of the trading range. The end and beginning of months tend to be bullish and the ES may be forming an A-B-C correction. The C top around 1962.50 for the ESH6 is a likely upside target.
The minis got a little overbought Friday, so a small pullback into the 10-day moving average is possible. But as long as the support around 1892-93 prevents the price from falling, the futures are likely to move back above Friday’s high.
Major support levels: 1875-78.50, 1850-45, 1830-25
Major resistance levels: 1950-56, 1975-78, 1993.75-96.50
You can see Naturus.com’s full outlook for the week ahead at www.naturus.com
Chart: SPX daily chart to Jan. 29. 2016