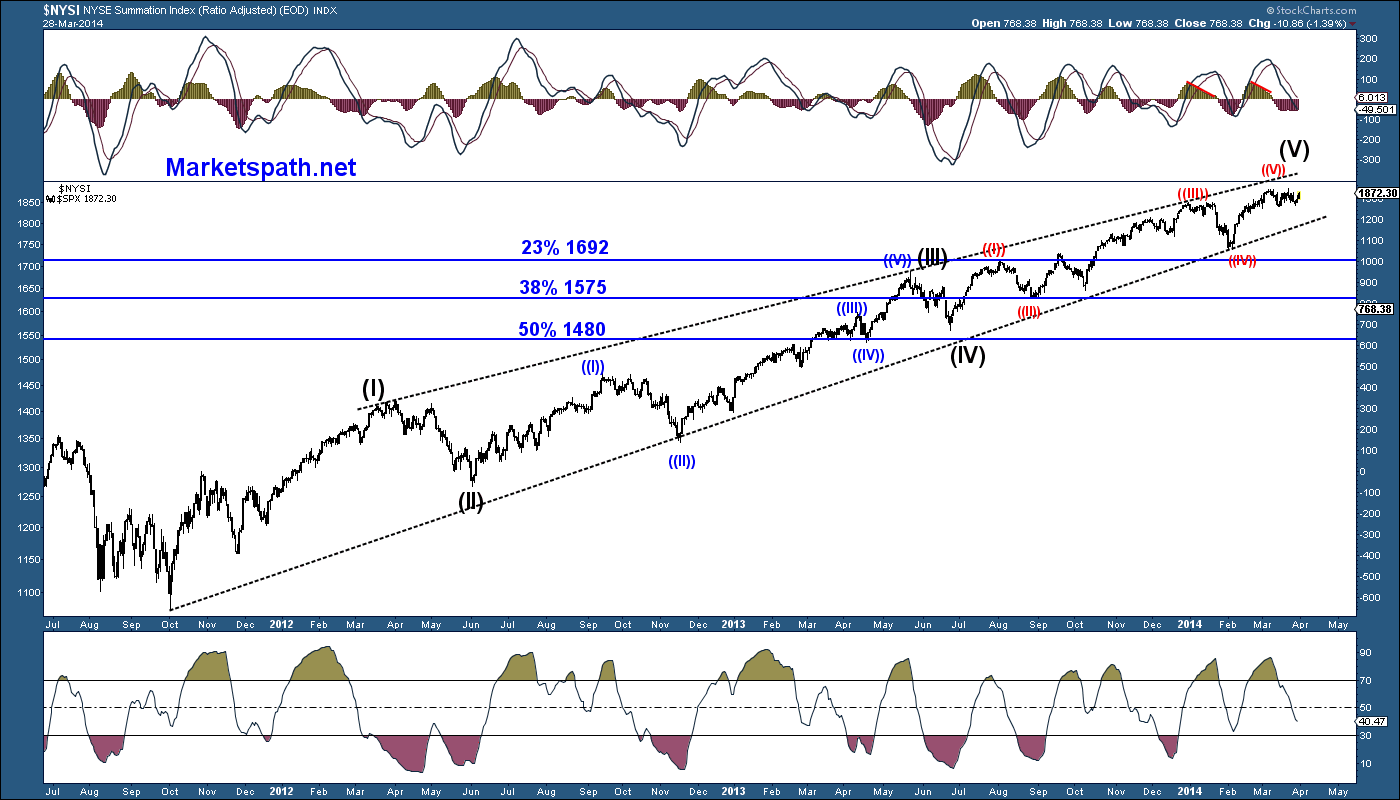
Elliott Wave counting has become very popular in the last 14 years. There are financial websites that are dedicated to only that style of charting. I am not one of those traders that has mastered E-wave and nor do I rely on it 100%.
I like to use it on an intermediate and then short term time frames. It helps me see where we are within the rally or drop. The basic rules for Elliott wave charting, is there will be five waves up or down, depending on the direction. When we are in the fifth wave of a move, it typically means a reversal will follow once it completes.
If we are in an uptrend and using Elliott Waves to determine where we are, the first wave would be up-second down third up (the strongest moves happen in wave threes) wave four down and then the final wave five up. Using Elliott Wave on a shorter time frame, you really want to just trade the trend. Use the wave twos and fours to add to a position.
But when looking at Elliott Wave on a longer time frame, I do trade the wave twos/fours and use Fibonacci levels for potential targets. Wave twos are typically the sharpest counter trend wave’s and can retrace up to 78% of wave one. Wave fours are not as powerful and typically retrace 23%-38% of the entire move.

When looking at the current five wave structure on the SPX (S&P 500 Index) from the 09/2012 lows, we appear to be completing a wave three. Once that finishes, wave four down should be next and using the Fibonacci retracements as potential targets, 1693 to 1575 would make sense. From the current levels, that is enough points (180 spx-23%) to be looking for a short trade. Click here to see the short term detailed chart


