

From the Sentiment Timing Newsletter by Woody Dorsey …
Stocks continued their “slow motion breakout” as expected. The 97% Bullish on 2/17 indicated an excess of optimism and signaled the potential for indigestion. Indeed, the market went nowhere for several days so, “there was no trading edge.”
This illustrates the difference between Qualitative Time vs. Quantitative Time. My timing studies can indicate when stocks might make a big move and when they are unlikely to move importantly. I suggested stocks might not have much “energy” last week. Quantitative Time (market motion) is different than Qualitative Time (market energy.) Thus last week’s rangy trade was apt.
Now, the reversal on Friday fits with new upside market energy. Date clusters over the next six weeks are dynamic but not obvious. Pattern wise, stocks may need, within their breakout, a more defined shakeout before they set up for another move higher.
Combining Investor Sentiment with Wave Counts
Last week, we identified 2086 as a support level and that turned out to be the exact low before a new high was made. The wave structure had to be modified because of the new high and the best view is the SPX is making a wave 5 of (3) here. In layman’s terms, once this wave 3 completes, we should see another drop down towards the 2086 support. That would be a larger wave 4 down, which would then be followed by another thrust to new highs to complete the 5th wave.
Now there are enough waves to have completed this wave (3), as well as high bullish sentiment, so one has to be open minded that the SPX may be on its way to testing the 2086 level-to make the wave (4). The first signal for that scenario to play out is a break of the support 1 line at 2102. That would increase the odds of 2086 or support 2 being tested. Anywhere between 2086 and 2080 would make sense to find buyers. The line in the sand for this wave-count, road map to not be valid is if 2070 gets taken out. Then something else is going on.
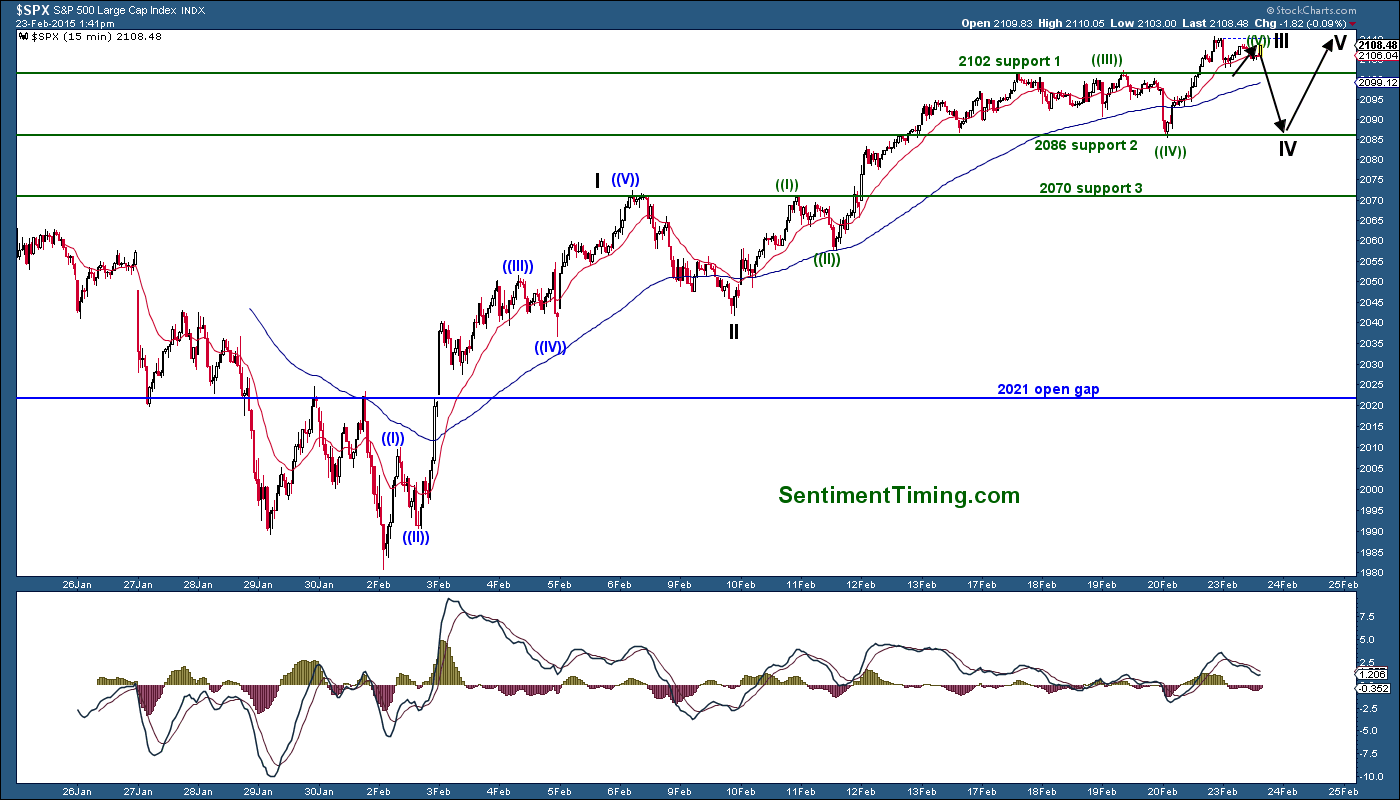
For now, leave the door open for a test of 2086, if the 2102 line is taken out. But another new high would also make sense, which most likely will find sellers, as the wave structure is mature at this time. From a technical view, as well as wave counts, there is no advantage right now. A better buy spot would be closer to the 2086 level.
####
To get your free sentiment chart and learn about how to track investor sentiment, please click here.

