

Last Week
The US large-cap index, the S&P 500 (SPX) had a pretty good week. It started off with a sharp decline in last Monday’s overnight trading, then marched steadily back to a new recent high above the psychologically-significant 2100 level and closed Friday (Apr. 10) at 2102.06, about half a point off the high of the week.
In fact, the SPX has had a good couple of years. Two years ago, in April 2013, it traded below 1540; last year at this time it was trading below 1820. Now we’re looking for a new high above 2120 – or better. The broadest index of large companies in the US market has gained about 40% since Easter two years ago.
Do that every couple of years, and you start to understand why the rich get richer. When you remember that more US families own more cats than own individual stocks (according to a 2013 Federal Reserve report) you start to understand why the wealth is so poorly shared. In fact, a University of California study determined that the wealthiest 10% of the US population own 88% of all financial assets, which is why the prosperous prosper, and everybody else shops for bargains on cat food.
This Week
The SPX (and the index mini-futures, ESM5, which we trade) has been trading inside a fairly wide range, from 2118 to 2045, but this range is likely to break soon and probably to the upside. There may be a short-term correction first but our overall outlook is bullish. We aren’t ready to call for another 20% gain this year, but we expect 2015 will end in the green.
Last week the SPX closed above 2100 for the first time since the mid-March pullback, and it may be able to close above that important level for the option expiration this week. You need to be a little cautious about that, because the market has had a habit of banging the close for option expiration (which is Friday) and then pulling back. But we’re looking up this week.
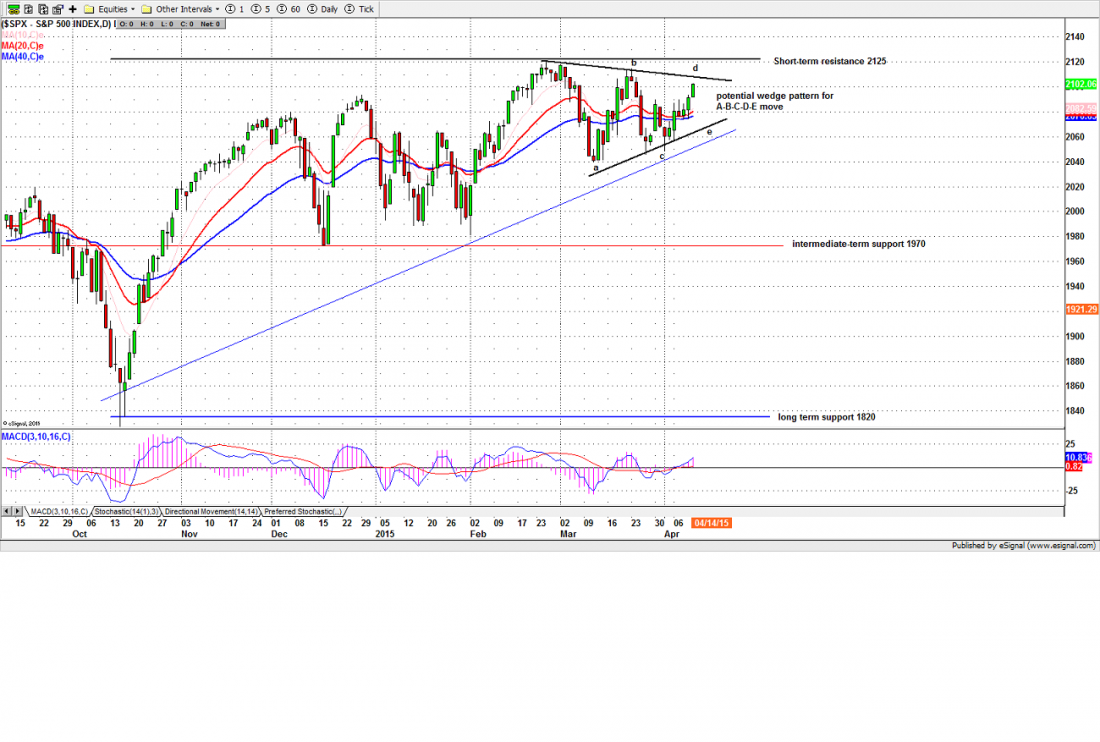
On the daily chart, the SPX has been making a series of lower highs and higher lows, forming a “wedge” pattern within a broader trading range. We have been expecting the SPX to make an A-B-C-D-E move within the wedge. (See chart).
Right now the SPX is at or near its projected D top area, and this week the index will show if that pattern works or not. If the SPX stays below 2110, it is possible for it to go for the E low, around the 2065 area. If it breaks above 2115 we’ll be reconsidering our interpretation of the price action and focusing on a bullish double bottom pattern instead.
Just remember that from a longer-term perspective the price action inside the 2125-to-2045 range is just noise. It won’t change anything until/if it moves outside that range.
ESM5
The S&P 500 mini-futures (ESM5) rallied up to 2096 on Friday and closed near the high. The price action was bullish, on light volume. Our guess is that many buyers were staying on the sidelines on Friday.
Today (Apr. 13) the ES is at a decision point. 2100-2098.50 is an important price point, a psychological resistance zone. A break above it indicates that the developing A-B-C-D-E pattern is invalid, and the breakout could create a bull run up to 2115-13 to retest March’s high.
A failure to break above that psychological resistance could send the ES back to last Friday’s low 2083-84. If it then moves further, below 2064, the outlook will be bearish. It would indicate that ES still intends to form an A-B-C-D-E pattern, and the price could drop back down to the 2050 area.
The trading strategy is to maintain a neutral position and watch for momentum strength if there is a breakout. Once a breakout move is confirmed, trade in the direction of the breakout.
Major support levels: 2075-73, 2066.50-65, 2036.25-35.50
Major resistance levels: 2115-18.50, 2035.50-38, 2146.50-48.50, 2156.50-58
SPX Daily Chart – Apr. 10, 2013
#####
Naturus.com publishes a free weekly analysis of US equity indices. To get on the mailing list, please click here.

