
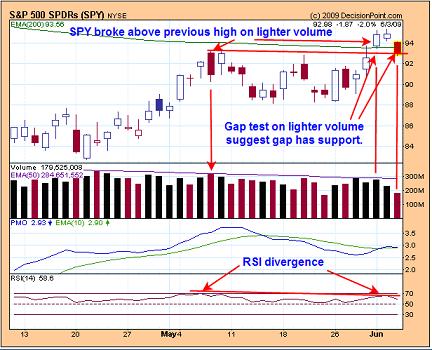
The SPY broke (gapped) above the previous high of 5/8 on lighter volume and suggests a false breakout to the upside. Today the SPY pulled back and tested the gap level on lighter volume and implies the gap has support. This could mean that the SPY may attempt to test yesterday’s high again for the short term. A weekly close (this Friday’s close) below 5/8 high (93.22) would imply the top is in. Also resistance lies at the 200 EMA of which the SPY is running into. There was also an RSI negative divergence as well as PMO divergence. Sometimes patience is needed and it appears to be one of those times. We are short the SPX at 883.92.
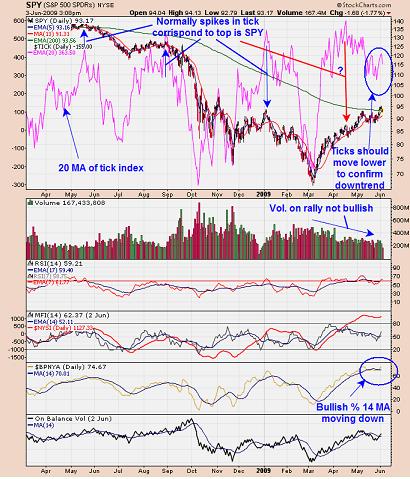
Above is the daily SPY. Normally when the 20 MA of the Tick reaches extreme and turns down a market top formed. The 20 MA tick reached extreme in mid April and the market still moved higher which was unusual. However, there are momentum indicators that suggest the market is at a high, like the Bullish Percent index 14 MA has rolled over and in on a sell signal. The 17 MA of the RSI also has rolled over and remains in downtrend. Notice the volume since March as been moving lower as the SPY has been moving higher. This condition shows that upside energy is leaving the market and a bearish sign. Also recently the SPY run into it’s 200 day moving average on reduced volume which implies the 200 day moving average has resistance.
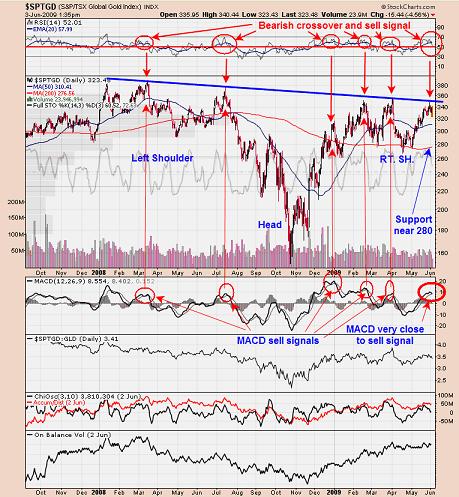
Above is the gold index for the Canadian market (SPTGD). It appears a Head and Shoulder bottom may be forming on SPTGD where the “Head” comes in at the 10/08 low. Recently this index tested the Neckline near 350 range and is a resistance level. The MACD is very near to triggering a sell signal and the 20 EMA for the RSI has had a bearish crossover and did trigger a sell signal. If the pull back continues, this index may find support near the previous lows of 280 range. If bullish conditions develop near 280 then that may be a good place to purchase gold issues. If the pattern of the Head and Shoulder does develop it would have an upside target to 560 range which would represent a 100% move from 280. To help confirm this Head and Shoulder bottom, we would need to see a “Sign of Strength” through the Neckline at the 350 range. For now we are expecting a pull back to the 280 range and we will se what happens there. Long GLD at 89 on 4/24/09. Long KRY at 1.82 on 2/5/08. We are long PLM at 2.77 on 1/22/08. Holding CDE (average long at 2.77 (doubled our position on 9/12/08 at 1.46, Sold 5/13/09 at 1.55=6% gain). Bought NXG at 3.26 on 6/4/07. We doubled our positions in KGC on (7/30/04) at 5.26 and we now have average price at 6.07. Long NXG average of 2.26. For examples in how “Ord-Volume” works, visit http://ord-oracle.com.

