By: Zev Spiro
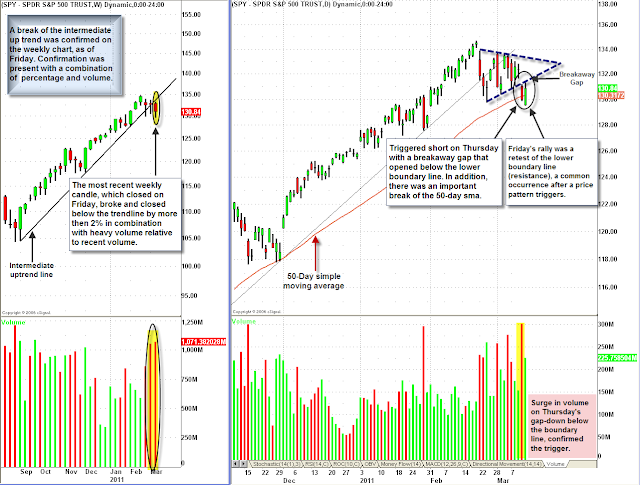
Last week’s SPDR S&P 500 Trust (SPY) candle broke the intermediate up trend line that began August 2010, with both percentage and volume confirmation present. In addition, I highlighted a consolidation pattern on the daily SPY chart, which could be considered a pennant or symmetrical triangle, both having the same implications. The pattern has converging boundary lines as the price consolidates and eventually breaks out. More commonly, it is a continuation pattern that resumes the same direction proceeding the pattern. The unusually high volume during development of this pattern was highlighted, a bearish sign.
The pattern triggered short on Thursday with a breakaway gap that opened below the lower boundary line with volume confirmation. In addition, the first close below the 50-Day Simple Moving Average occurred since September. Friday’s rally was a retest of the lower boundary line (resistance), a common occurrence after a price pattern triggers. The price may continue to grind below the boundary line. Based on the action of recent confirmed sell signals of major market indices, I suspect there will not be a confirmed move above the lower boundary line. SPY will likely roll over at some point this week with a short term target of $127. Outlined below is a short setup in T. Rowe Price Group, INC. (TROW) which triggered out of a distribution pattern last week, and retested resistance on Friday.
Chart 1: The left chart is a weekly chart of SPY which illustrates the break of the intermediate up trend line. The chart on the right is a daily chart of SPY outlining the trigger and retest of the pattern.
Chart 2: T. Rowe Price Group, INC. (TROW): The end of the intermediate uptrend was signaled by a confirmed break of the intermediate up trend line on January 28th. A complex head and shoulders pattern was developing since early January. The minimum expected price objective is 59 dollars, obtained by measuring the height of the pattern and expanding lower by the same distance, from the trigger point.
Last week a breakaway gap triggered the pattern, which is highlighted, followed by a retest of the neckline on Friday. The price may continue to test the neckline’s resistance for a few days. A low risk opportunity presents itself by shorting versus the neckline, resistance of the pattern. Target: $59 is the minimum expected objective. Protective stops: may be activated on a confirmed move back above the neckline and/or a daily close above the high of the right shoulder, which is $67.83.
Polo Ralph Lauren Corporation (RL): Market Letter 3/10/11 – Just broke above the flag resistance on Friday. Buy confirmation may present itself today.
Monsanto Company (MON): Market Letter 3/2/11- Short triggered last week and may provide another entry on a retest of the neckline.
The Hershey Company (HSY): Market Letter 2/28/11 – Active traders may wish to take off some profits if it breaks below 53.50 since the candlesticks are signaling that rest is needed.
STR Holdings, Inc. (STRI): Market Letter 2/24/11 – On Friday reported earnings. It retested the trigger area ($18) off the open and turned down quickly. First and short term target of $14.50 is approaching.
If you are interested in receiving Zev Spiro’s market letter, please email zevspiro@oripsllc.com subject “T3”
*DISCLOSURE: Short SPY, TROW
This material is being provided to you for educational purposes only. No information presented constitutes a recommendation by T3 LIVE or its affiliates to buy, sell or hold any security, financial product or instrument discussed therein or to engage in any specific investment strategy. The content neither is, nor should be construed as, an offer, or a solicitation of an offer, to buy, sell, or hold any securities. You are fully responsible for any investment decisions you make. Such decisions should be based solely on your evaluation of your financial circumstances, investment objectives, risk tolerance and liquidity needs. Visit the T3Live Homepage, Virtual Trading Floor, and Learn More About Us.


