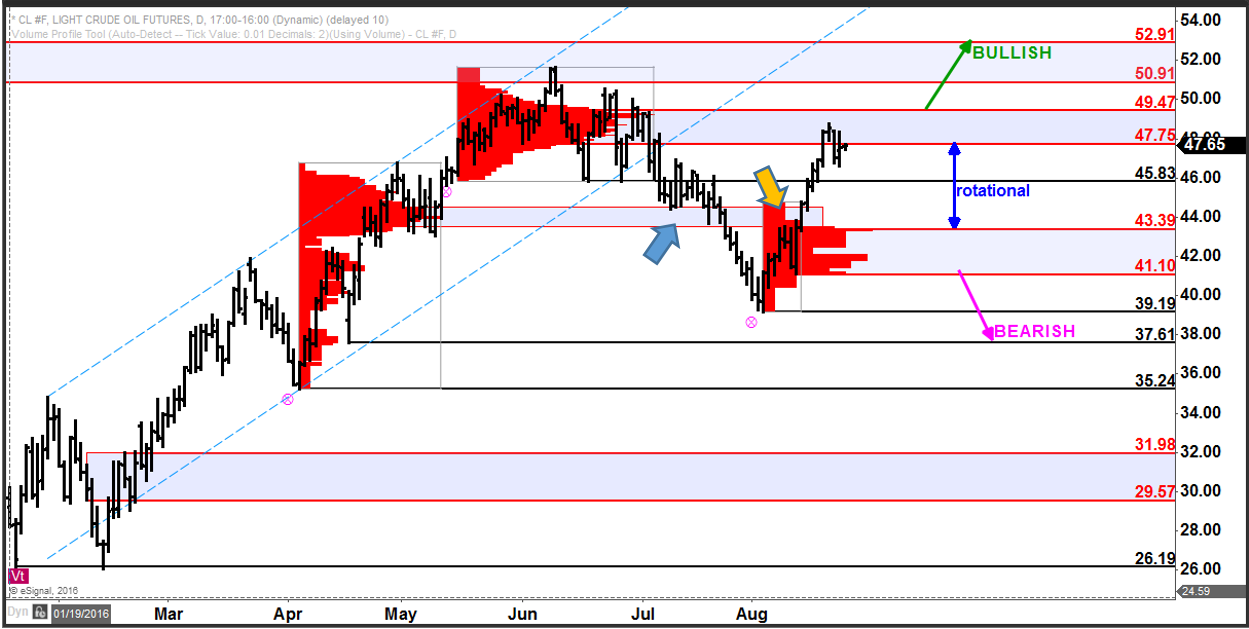
Crude oil has demonstrated once again how volume-at-price information allows traders in-the-know to stay one step ahead of everyone else.
Click here to watch a video explaining how to read markets using volume at price.
Crude oil has been marching back to the upside in August, especially since breaking above resistance, now support, at 43.39. This is a key inflection point, initially defined as support by the high-volume area created back in April-May at 43.39 – 44.83. That zone of support was known well in advance of the repeated tests that held for 12 sessions during the first half of July before breaking (blue arrow).
On the rally back to test 43.39 from below, it provided resistance for 4 sessions before being pierced to the upside and unleashing the most recent rally (yellow arrow).
That rally lost its steam last week as it hit the well-defined zone of high-volume resistance at 47.75 – 49.47, another well-defined zone known well in advance of price reaching it.
Markets are unpredictable and often do things that cannot be anticipated far in advance. As a trader however, knowing important price locations as revealed by volume-at-price information and viewing the markets in the proper context can guide you to making appropriate decisions about where and when to take (or take off) risk.