

The Nasdaq futures slid about 1% on light volume shortly after Friday’s weak jobs report, and then they closed for the weekend. Having printed a bearish inverse “Cup and Handle” pattern on the 240-minute chart, the futures are now (Sunday evening) in the process of retesting that downside breakout.
If the bulls can grab the football, they need to get above the gold downtrend line to get upside traction. The line in the sand is 4315 or thereabouts.
Otherwise, 4 downside targets are in play, which would make sense if in fact the market has now shifted to gap-hunting. The gap at 4209 would be the most significant initial target. But, if we head down there, the Volume Profile Point of Control lies at 4045, and it would serve as a compelling “attractor.”
The 4045 level represents an area the institutional bulls would defend, so keep some powder dry.
A Note on Volume Profile
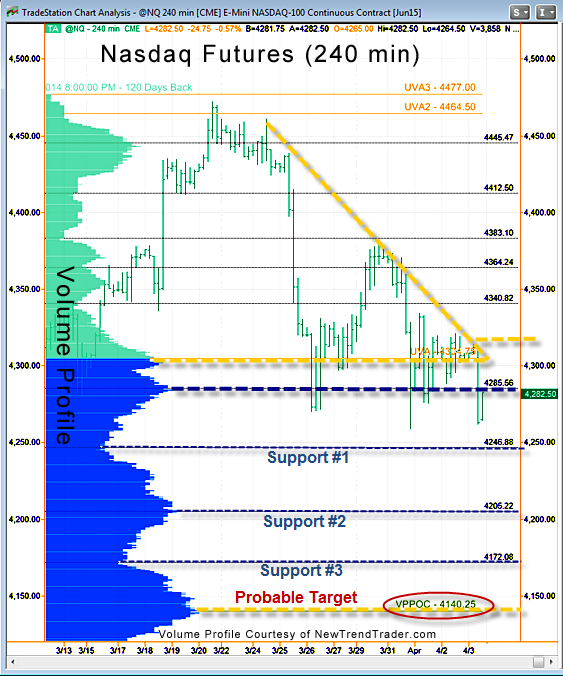
The histogram on the left side of the chart shows the volume distribution in the Nasdaq futures for different periods of time. Key support and resistance levels are indicated by the peaks and troughs.
#####
If you would like to receive a primer on using Volume Profile, please click here.

