
Acronyms are everywhere in the world of trading, and as new acronyms are born, they potentially hold within them valuable information for traders to utilize.
Jim Cramer’s Mad Money show on CNBC in 2013, coined the term “FAANG” stocks to describe a group of high-performing tech stocks that he believed were poised for continued success. The acronym stands for Facebook, Amazon, Apple, Netflix, and Google (now Alphabet). At the time, these companies were relatively new to the stock market and had relatively small market caps. But thanks to their innovative products and business models, they quickly became some of the most valuable companies in the world. Over the years thousands of articles and analysis has been done on FAANG to prognosticate its utility to traders.
The term FAANG stocks became popularized amongst traders and these 5 stocks grew massive in popularity and market cap and continued to dominate their sectors.
FAANG became the most popular acronym to describe the phenomena of bellwether stocks.
A bellwether stock is a leader that is indicative of the direction of the overall market or a specific sector. The importance of bellwether stocks is determined by traders who study how these stocks react to various news events, analyst ratings, and other factors. By analyzing the price action of bellwether stocks, traders can gain insights into the underlying trends in the markets and make more informed trading decisions. Studying bellwether stocks can give traders an edge in navigating these volatile waters. Many years ago, General Motors was a bellwether. Employees at $GM were quick to comment that what was good for General Motors was good for the country.
Wall Street is hungry to discover bellwether stocks that are seen as an indicator for the overall performance of the market. Often, these are market leaders that move before the rest of the market. Today, some examples of bellwether stocks include Apple, Microsoft, and Amazon. While these companies are not necessarily representative of the entire market, their performance is often seen as an indicator of how the market is doing.
However, in 2022 a few things have happened and the FAANG acronym is no longer in vogue. Essentially Netflix and Facebook have had a horrible performance which has affected the effectiveness of utilizing FAANG as a leading indicator of stock market behavior.
Netflix had been one of the hottest stocks on Wall Street over the last few years, but the company has hit a rough patch. In the last 12 months, Netflix’s stock has lost nearly 63% of its value.
There are several factors that have contributed to Netflix’s struggles. First, earnings have been disappointing. In each of the last two quarters, Netflix has missed earnings estimates by a wide margin. This has caused investors to lose confidence in the company’s ability to grow earnings at a fast clip. Second, competitors such as Hulu and Amazon Prime Video are starting to eat into Netflix’s market share. These companies are investing heavily in content and marketing, and they’re starting to attract more subscribers. Finally, the online streaming market is becoming saturated. There are now dozens of different streaming services available, and it’s becoming harder for Netflix to stand out from the crowd.
Looking ahead, it’s unclear whether Netflix will be able to turn things around. The company is facing increasing competition and slowing growth, and it remains to be seen if Netflix can return to its past levels of success.
It’s also been a tough year for Facebook. The social media giant has seen its stock price tumble down over 57% over the last year, and in 2022 recently announced disappointing earnings. So, what’s behind the downturn?
Facebook ($META) is focused on creating the infrastructure for the Metaverse and virtual/augmented reality. The company is not expected to be profitable for many years while it undertakes this Herculean task.
Looking ahead, it’s hard to say how Facebook will fare. The company is clearly facing some serious challenges, but it remains the most popular social media platform in the world. Only time will tell if Facebook can turn things around.
Wall Street analysts quickly recognized that with horrible performances by Facebook ($META) and Netflix ($NFLX) that FAANG was clearly an acronym of the past. As a response to the poor performance of these two industry giants, some leading analysts have chosen to eliminate Facebook and Netflix from the bellwether category and instead replaced them with NVIDIA ($NVDA) and Microsoft ($MSFT).
The newest trading acronym is “MATANA” which you will be hearing a lot about in the future.
“M” – Microsoft
“A” – Apple
“T” – Tesla
“A” – Amazon
“N” – Nvidia
“A” – Alphabet (Google)
Let’s dig in to see how big these companies are in terms of market capitalization as well as how much of the S&P 500 Index do they represent.
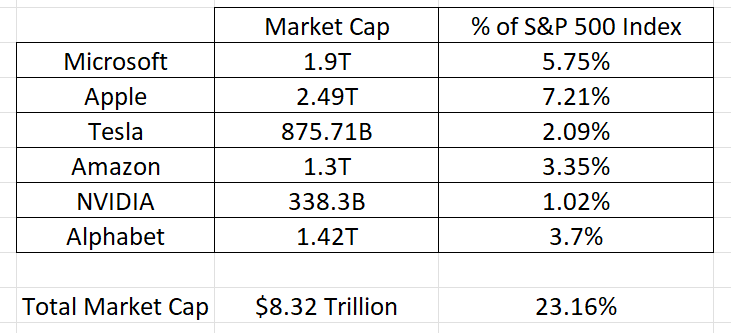
At present time, the entire value of the S&P 500 Index is roughly worth $36 trillion. You can see in the analysis above that the 6 stocks which compose “MATANA” represent 23.16% of the entire S&P 500 Index and they have a market cap of $8.32 trillion.
MATANA stocks are important to traders because they provide a good way to gauge the overall health of the tech sector and their performance is often used as a benchmark in the media to herald economic trends in the US economy.
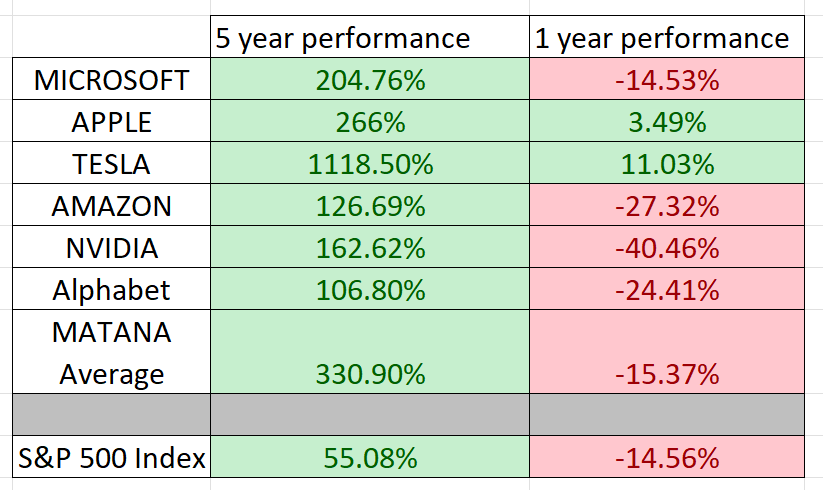
When these stocks rally chances are they will carry the broader market along with them. Likewise, when they struggle the rest of the market will also have difficult trends to contend with. Historically they have dramatically outperformed the S&P 500 Index over the past few years.
For Vantagepoint Power Traders “MATANA” stocks will add a powerful confirmation signal to your trading.
Let’s look at these 6 stocks individually over the past month.
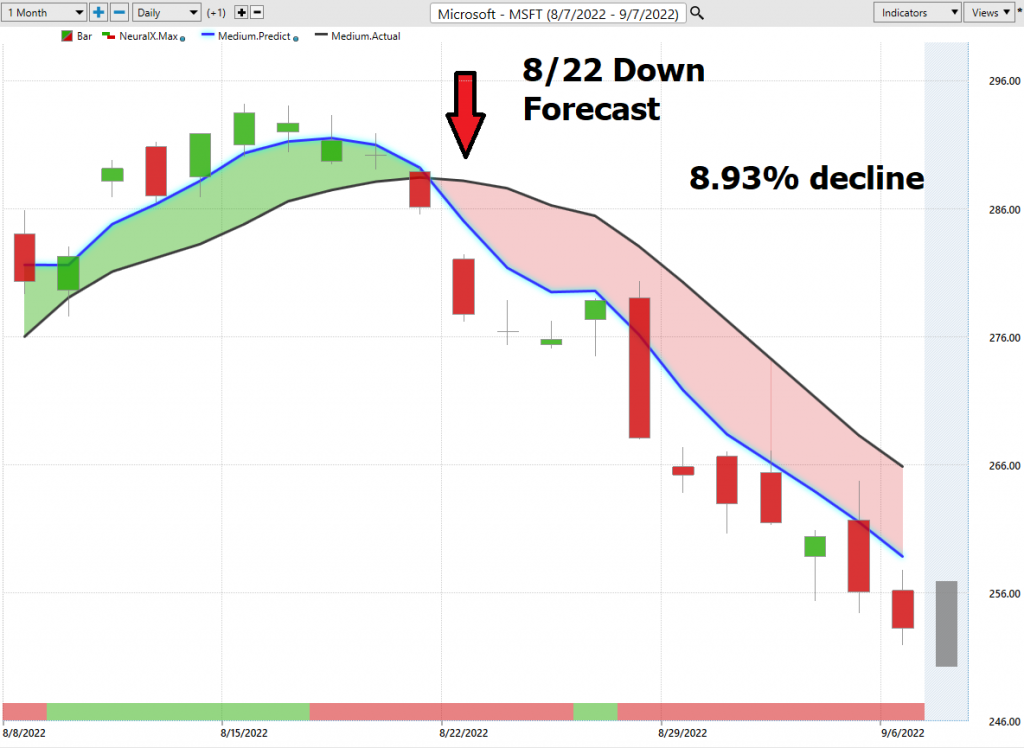
Here is Microsoft ($MSFT). The a.i. forecast began sloping downward officially on August 19th and officially turned negative on August 22ns resulting in an 8.93% decline.
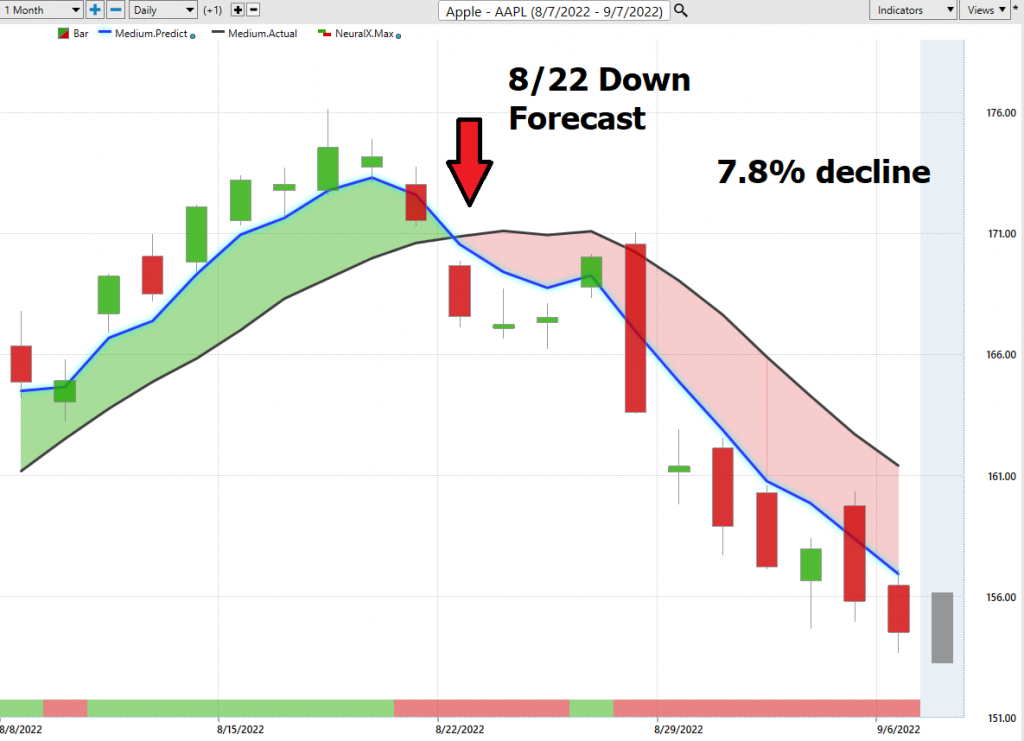
Here is Apple ($AAPL). The a.i. forecast began sloping downward on August 19th and officially turned negative on August 22nd resulting in a 7.8% decline.
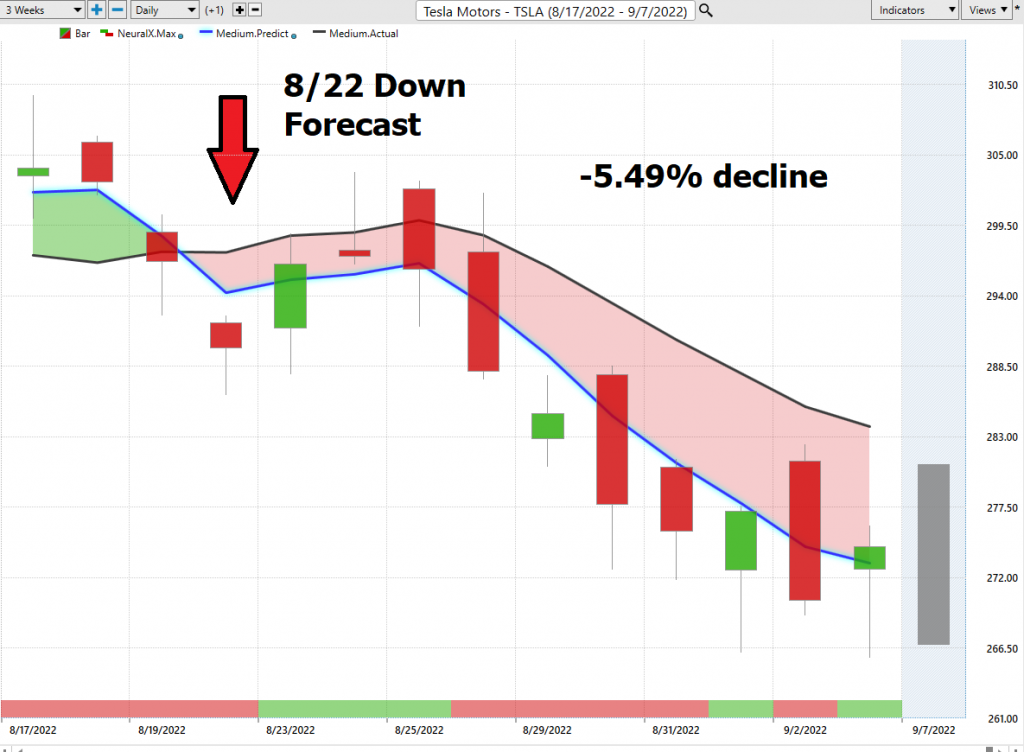
Here is Tesla ($TSLA). The a.i. forecast began sloping downward on August 18th and officially turned negative on 8/22 resulting in a 5.49% decline.
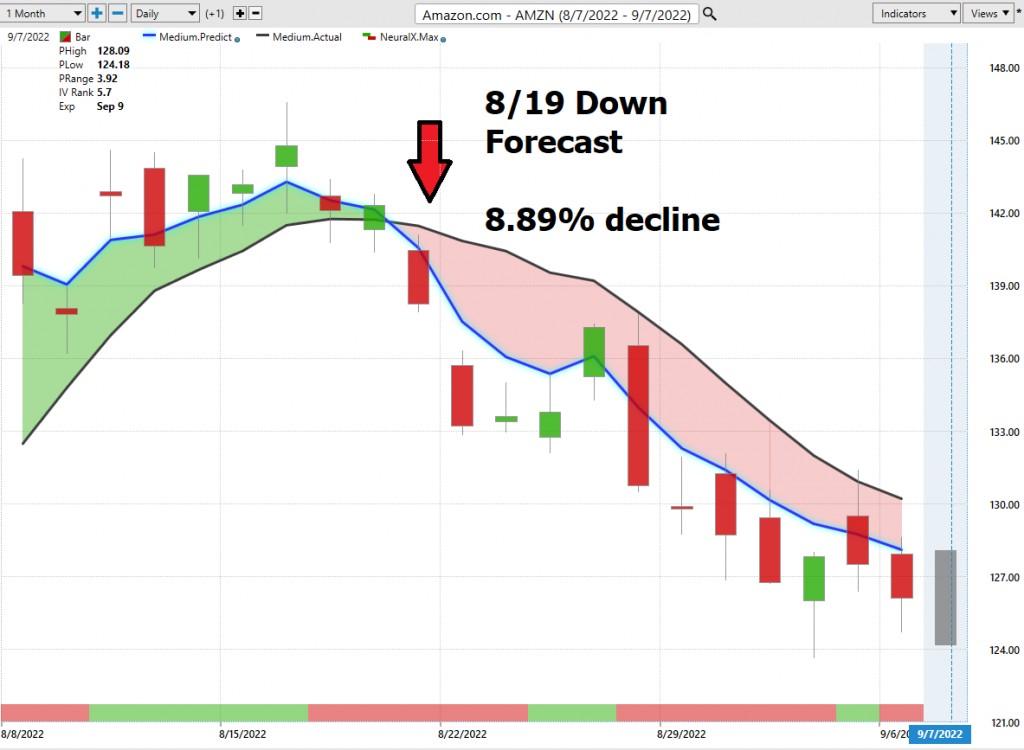
Here is Amazon ($AMZN). The a.i. forecast began sloping downward on August 17th and officially turned negative on August 19th resulting in an 8.89% decline.
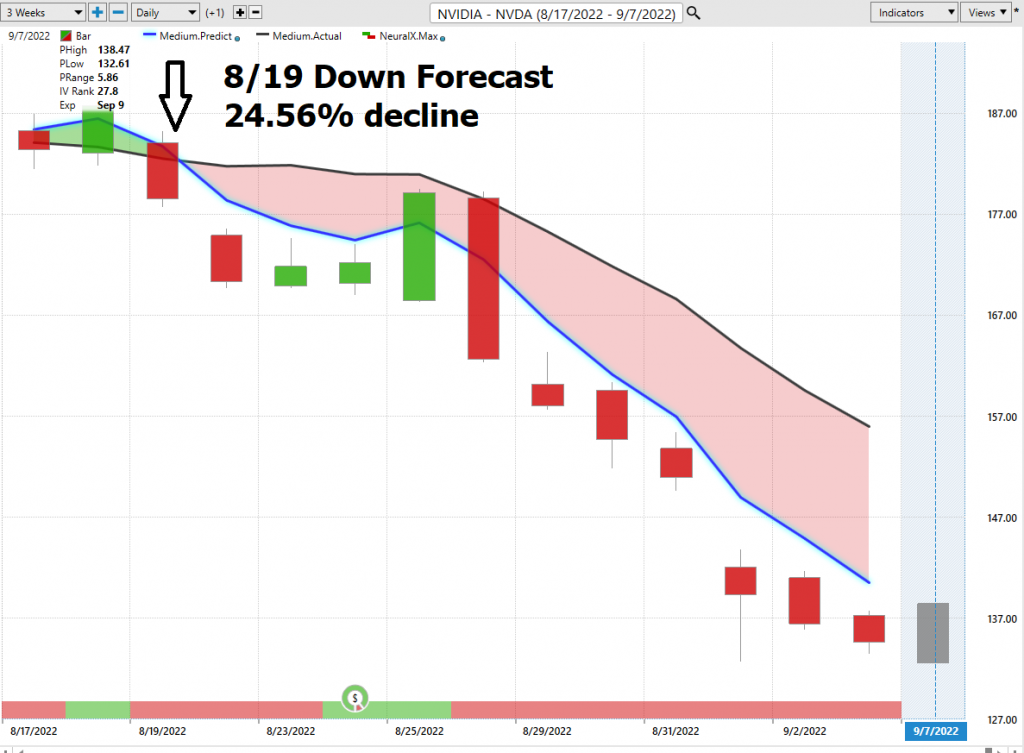
Here is NVIDIA ($NVDA). The a.i forecast turned negative on August 19th and has resulted in a 24.56% decline.
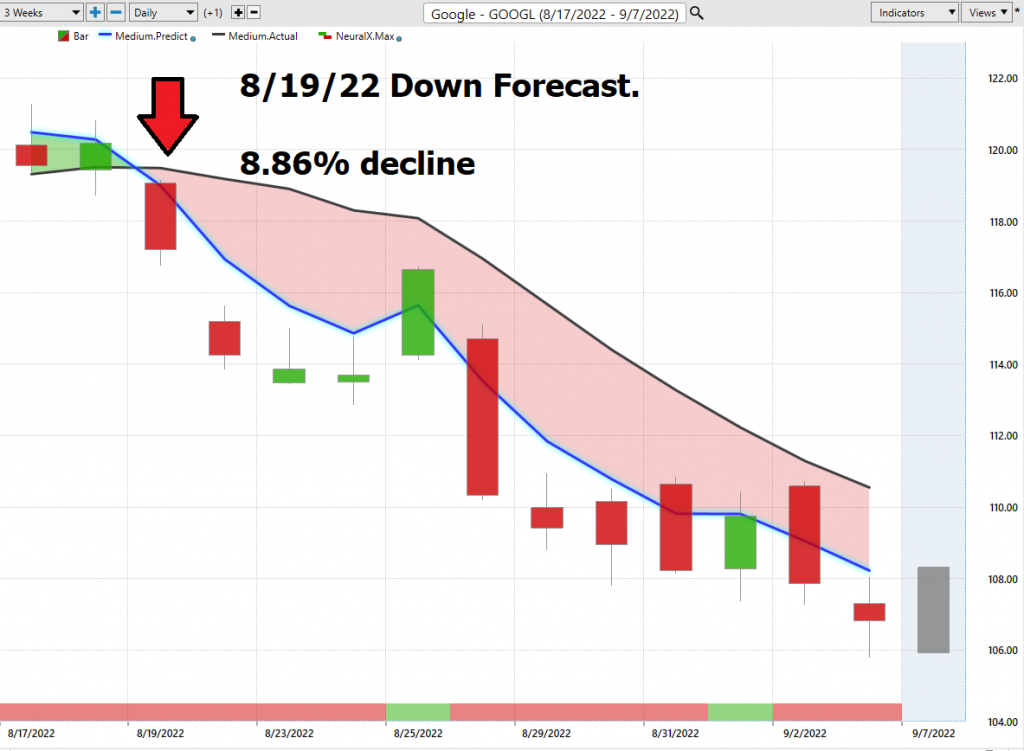
Lastly, here is Google parent company Alphabet ($GOOGL). You can see that the a.i. forecast turned negative on August 19th and has resulted in an 8.86% decline.
We can quickly see that MATANA stocks move together and do lead the broader market. Power Traders who monitor MATANA stocks could see on August 18th and 19th that the trend was weakening and turning lower. By August 22nd, all MATANA stocks were officially in downtrends. They have all fallen anywhere from 5% to 24%.
Since MATANA consists of 6 companies with a market cap if over 8 trillion dollars and consist of over 23% of the S&P 500 Index you can rest assured that Wall Street will be building out product offerings that are heavily correlated to MATANA performance.
Moving forward all 6 stocks are currently in downtrends.
You can see from the charts above that these trends were extremely easy to discern and there was no guesswork involved.
Google, Microsoft, and NVIDIA are all testing their 52-week lows. Based upon these factors traders should either be short or out of the market looking for the next uptrend forecast to arrive.
MATANA are the new Bellwether stocks that are closely watched by investors and analysts as indicators of market trends. Because these companies are large, well-established leaders with diverse customer bases, their performance is often seen as a good gauge of overall economic conditions. As such, they can be useful tools for making buying and selling decisions.
If the bellwethers are doing well, it will usually signal that the market is doing well and that it could be a good time to buy. Conversely, if the bellwethers are struggling, it may signal that the sector is struggling and that it could be a good time to sell. Of course, this is just one factor to consider; other factors such as volatility and risk must also be considered. Nevertheless, following MATANA bellwether stocks will be another helpful way to make informed buying and selling decisions.
For Power Traders who desire to get more granular we recommend applying our decision-making process which we feature weekly here on our blog. It consists of decision-making based upon the tried-and-true valuation and momentum indicators of the following performance benchmarks.
- Wall Street Analysts’ Estimates
- 52-week high and low boundaries
- Vantagepoint A.I. Forecast (Predictive Blue Line)
- Neural Network Forecast
- Daily Range Forecast
- Intermarket Analysis
Let’s Be Careful Out There!
Remember, It’s Not Magic.
It’s Machine Learning.

IMPORTANT NOTICE!
THERE IS SUBSTANTIAL RISK OF LOSS ASSOCIATED WITH TRADING. ONLY RISK CAPITAL SHOULD BE USED TO TRADE. TRADING STOCKS, FUTURES, OPTIONS, FOREX, AND ETFs IS NOT SUITABLE FOR EVERYONE.
DISCLAIMER: STOCKS, FUTURES, OPTIONS, ETFs AND CURRENCY TRADING ALL HAVE LARGE POTENTIAL REWARDS, BUT THEY ALSO HAVE LARGE POTENTIAL RISK. YOU MUST BE AWARE OF THE RISKS AND BE WILLING TO ACCEPT THEM IN ORDER TO INVEST IN THESE MARKETS. DON’T TRADE WITH MONEY YOU CAN’T AFFORD TO LOSE. THIS ARTICLE AND WEBSITE IS NEITHER A SOLICITATION NOR AN OFFER TO BUY/SELL FUTURES, OPTIONS, STOCKS, OR CURRENCIES. NO REPRESENTATION IS BEING MADE THAT ANY ACCOUNT WILL OR IS LIKELY TO ACHIEVE PROFITS OR LOSSES SIMILAR TO THOSE DISCUSSED ON THIS ARTICLE OR WEBSITE. THE PAST PERFORMANCE OF ANY TRADING SYSTEM OR METHODOLOGY IS NOT NECESSARILY INDICATIVE OF FUTURE RESULTS. CFTC RULE 4.41 – HYPOTHETICAL OR SIMULATED PERFORMANCE RESULTS HAVE CERTAIN LIMITATIONS. UNLIKE AN ACTUAL PERFORMANCE RECORD, SIMULATED RESULTS DO NOT REPRESENT ACTUAL TRADING. ALSO, SINCE THE TRADES HAVE NOT BEEN EXECUTED, THE RESULTS MAY HAVE UNDER-OR-OVER COMPENSATED FOR THE IMPACT, IF ANY, OF CERTAIN MARKET FACTORS, SUCH AS LACK OF LIQUIDITY. SIMULATED TRADING PROGRAMS IN GENERAL ARE ALSO SUBJECT TO THE FACT THAT THEY ARE DESIGNED WITH THE BENEFIT OF HINDSIGHT. NO REPRESENTATION IS BEING MADE THAT ANY ACCOUNT WILL OR IS LIKELY TO ACHIEVE PROFIT OR LOSSES SIMILAR TO THOSE SHOWN.

