

Moderna (MRNA)
This week’s stock analysis is MODERNA (MRNA).
Moderna is an American biotechnology company based in Cambridge, Massachusetts. It focuses on drug discovery, drug development, and vaccine technologies based exclusively on messenger RNA (mRNA).
With the COVID-19 pandemic and ensuing economic lockdown Moderna (MRNA) became one of the darlings of Wall Street offering giant hope for a vaccine that would help put an end to the pandemic.
Moderna opened 2020 trading at $19.23. It traded as high as $178.50 and closed the year at $104.47. The Food and Drug Administration authorized its coronavirus vaccine for emergency use.

Moderna (MRNA) joined Pfizer (PFE) and partner BioNTech (BNTX) with an FDA authorized coronavirus vaccine on Dec. 18, 2020. Both vaccines use messenger RNA technology to prompt an immune response. This is Moderna’s first commercial product so Moderna isn’t profitable yet. So far, the company has reported losses every year since its start in 2016. Moderna has reported that its coronavirus vaccine was 94.1% effective in a Phase 3 test.
Since the company is not profitable, it’s considered to be a highly volatile asset and will continue to have wide price ranges based upon its success in rolling out its vaccine.
At this writing, the stock is trading at roughly $124 per share. What is fascinating about Moderna’s longer term prospects is the wide divergent opinions of analysts forecasts which can be found on most financial websites. Currently 13 analysts are offering 12-month forecasts with a median price estimate of $150. The high estimated forecast is $186, and the low estimate is $69. The median estimate represents a 21% increase from where Moderna (MRNA) is currently trading.
Let’s first start off with the common-sense metrics and an annual look at the chart of Moderna (MRNA).
Any trader who invested $10,000 in Moderna at the beginning of 2020 would be sitting on over $50,000 worth of open profits today.
Over the last 52 weeks MRNA has traded as low as $17.91 and as high as $178.50. This provides us with an annual trading range of $160.59. When we divide this value by 52 weeks, we come up with an average weekly trading range of $3.08. This metric, on a very broad basis, only helps define what normal weekly stock movement is.
Using a.i. we look to capture many times that value during the time we are trading this particular asset.
We emphasize the 52-week high as a price level all traders should be very aware of when choosing market selection and deciding on a trading strategy. When we zoom out on Moderna we can very quickly see, what we expect to see, whenever price approached its 52-week high level. At first the area acted as very solid resistance. But when the level is successfully breached, which occurred in early April 2020, the stock exploded higher and has never returned to those levels. On Wall Street the adage is buy low sell high. While that is a worthy objective some big money has been made by focusing on solid trends and focusing your money on learning to buy high and sell higher.

We are advocates of becoming extremely aware, at all times of the 52-week trading range of any stock that we are looking to either trade or invest in. The 52-week high boundary often acts as major resistance to a stock advance until it is breached. Once a stock successful closes above its 52-week high, it is very common for a stock to continue to move higher. We do not take this on faith but apply our artificial intelligence to this reality to be able to fine tune our entries and exits.
Please observe on the long-term chart above how the previous 52-week high acts as major resistance to MRNA. Once MRNA breached that price level it has gone on to move substantially higher in a very short period. Traders have gone on to see 5-fold increase in this stock since the 52-week high level was breached.
On March 18th, 2020 MRNA closed at $31.58. The a.i. turned positive when the predictive blue line crossed above the black line. Power traders use the price level of the predictive blue line as a value zone to try and purchase the asset “at or below” that price level.

Using the Vantagepoint A.I. Software traders were alerted that the ideal value zone on this uptrend was in trying to purchase MRNA at or below the predictive blue line on the chart. There were five trading sessions where traders could’ve purchased MRNA between the price of $24.76 and $26.20.
Power traders use the predictive blue line in helping to determine both the value zone as well as the trend direction. The slope of the blue line is a forecast of future trend direction.
At the bottom of the chart is the Neural Network Indicator which predicts future strength and/or weakness in the market. When the Neural Net Indicator is green it communicates strength. When the Neural Net is Red it is forecasting short term weakness in the market.
From March 18th forward the Neural Network turned GREEN and for the next two months remained GREEN. Observe how the price of MRNA consistently closed above the predictive blue line during this time frame.
From March 18th to May 18th Moderna exploded up 175% increase per share in 43 trading sessions.
We advocate that Power Traders cross reference the chart with the predictive blue line and neural network indicator to create optimal entry and exit points.
Power Traders are always looking to apply both the neural network and a.i. to the markets to find statistically sound trading opportunities.
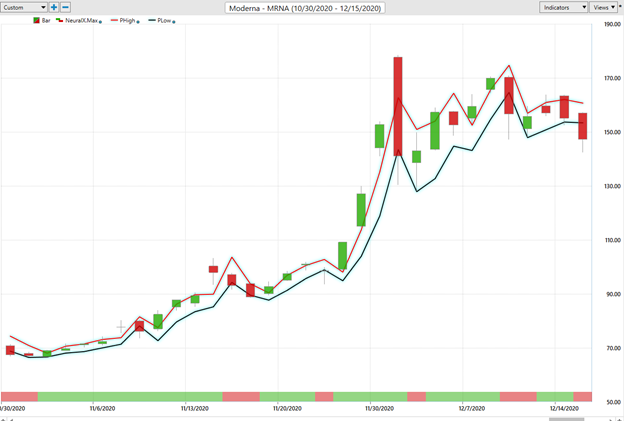
Below is a chart of the most recent runup in MRNA.
On November 6th MRNA closed at $72.45. The predictive blue line moved above the black line indicating that the future trend direction was up. At this time, the Neural Network was also GREEN. In only 17 trading sessions MRNA moved 144% higher making its all time high for the year at $178.50.

VantagePoint Software Daily Price Range Prediction
One of the powerful features in the Vantagepoint A.I. Software which Power Traders use on a daily basis is the Price Range prediction forecast.
This forecast is what permits Power Traders to truly fine tune their entries and exits into the market.
At 6:30pm after the market close the software updates and all of the price predictions change based upon what the machine learning, a.i., neural networks, and intermarket analysis anticipate moving forward.
Here is the price chart of MRNA during the most recent runup featuring only the Daily Price Range forecast.
One of the most challenging aspects of trading is stop placement after you have chosen to enter the market. Observe how placing protective sell stops below the dark line on the chart was a powerful way to minimize risk on this trade.
Intermarket Analysis
We live in a global marketplace.
Everything is interconnected.
Interest rates, Crude Oil Prices, and the Volatility of the dollar amongst thousands of other variables affect the decisions companies must make to flourish and prosper in these very challenging times. Trying to determine what these factors are is one of the huge problems facing investors and traders.
You always have a choice. You can tune in to the talking heads in the media who spin talking points which promote fear. Or you can rely on facts to base your decision making on.
There is great value to be had in studying and understanding the key drivers of MRNA’s price action. This graphic provides a microcosmic view of what factors are driving the Vaccine universe and the most statistically correlated assets. These factors are all displayed from a standpoint of statistical correlations which show the strongest interconnectedness of prices.

While Moderna has proven to be quite volatile, it has presented traders with incredible trading opportunities in 2020.
Here is a snapshot of the most recent Vantagepoint A.I. Forecast for Moderna which just turned bullish again on Friday January 15, 2021.
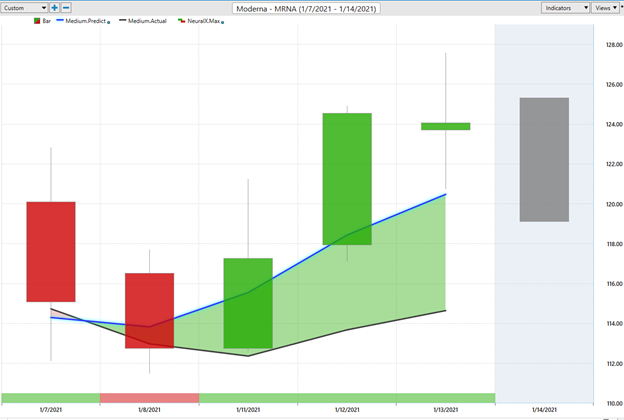
Power traders have been buying MRNA below the predictive blue line and currently have protective sell stops in place in case the market suddenly reverses.
It’s clear that a Covid-19 vaccine is desired and needed to help return the world to a more normal environment.
Billions of dollars are on the way from world governments who are anxious for a vaccine solution to COVID-19. While investing in MRNA is highly speculative at this point it does also hold significant potential. Some analysts believe that a COVID-19 vaccine will be required every three years which will add even more potential to the bottom line.
Our suggestion. Follow the a.i. trend analysis and practice good money management on all of your trades. With 13 professional analysts following the stock and all having very wide divergent estimates this is an asset that is sure to be very volatile. With the a.i. in your corner the volatility can be a great recipe to bank quick profits. However, if you are a buy and hold investor, MRNA is in for a very wild ride in 2021.
Let’s Be Careful Out There!

IMPORTANT NOTICE!
THERE IS SUBSTANTIAL RISK OF LOSS ASSOCIATED WITH TRADING. ONLY RISK CAPITAL SHOULD BE USED TO TRADE. TRADING STOCKS, FUTURES, OPTIONS, FOREX, AND ETFs IS NOT SUITABLE FOR EVERYONE.
DISCLAIMER: STOCKS, FUTURES, OPTIONS, ETFs AND CURRENCY TRADING ALL HAVE LARGE POTENTIAL REWARDS, BUT THEY ALSO HAVE LARGE POTENTIAL RISK. YOU MUST BE AWARE OF THE RISKS AND BE WILLING TO ACCEPT THEM IN ORDER TO INVEST IN THESE MARKETS. DON’T TRADE WITH MONEY YOU CAN’T AFFORD TO LOSE. THIS ARTICLE AND WEBSITE IS NEITHER A SOLICITATION NOR AN OFFER TO BUY/SELL FUTURES, OPTIONS, STOCKS, OR CURRENCIES. NO REPRESENTATION IS BEING MADE THAT ANY ACCOUNT WILL OR IS LIKELY TO ACHIEVE PROFITS OR LOSSES SIMILAR TO THOSE DISCUSSED ON THIS ARTICLE OR WEBSITE. THE PAST PERFORMANCE OF ANY TRADING SYSTEM OR METHODOLOGY IS NOT NECESSARILY INDICATIVE OF FUTURE RESULTS. CFTC RULE 4.41 – HYPOTHETICAL OR SIMULATED PERFORMANCE RESULTS HAVE CERTAIN LIMITATIONS. UNLIKE AN ACTUAL PERFORMANCE RECORD, SIMULATED RESULTS DO NOT REPRESENT ACTUAL TRADING. ALSO, SINCE THE TRADES HAVE NOT BEEN EXECUTED, THE RESULTS MAY HAVE UNDER-OR-OVER COMPENSATED FOR THE IMPACT, IF ANY, OF CERTAIN MARKET FACTORS, SUCH AS LACK OF LIQUIDITY. SIMULATED TRADING PROGRAMS IN GENERAL ARE ALSO SUBJECT TO THE FACT THAT THEY ARE DESIGNED WITH THE BENEFIT OF HINDSIGHT. NO REPRESENTATION IS BEING MADE THAT ANY ACCOUNT WILL OR IS LIKELY TO ACHIEVE PROFIT OR LOSSES SIMILAR TO THOSE SHOWN.

