
![]()
This week’s stock analysis is Waste Management (WM).
The garbage business is not glamorous, but it is profitable. While many companies were decimated by the covid-19 pandemic and economic lockdown, WM was hardly affected at all. Waste Management’s business held up exceptionally well. Its top line fell a mere 1.5%. This is something that Wall Street was slow to realize, but somebody has to pick up the garbage, regardless of the issues facing the world. The truly amazing thing about WM is that it is a giant $15 billion in revenue company that serves 20 million customers. Amongst its most profitable line of business is 244 solid waste landfills and five hazardous waste landfills.
The company has increased its annual dividend for 17 consecutive years which makes the company very attractive to baby boomers who are looking to retire. A growing population ensures that there will always be more trash that needs to be recovered and recycled. What 2020 proved to skeptics was that WM is a very strong and well diversified company capable of flourishing even amongst the worst of business environments.
WM is a stock that is very popular with investors and hedge funds. It’s expected to report earnings on 04/27/2021 before the market open. The report will be for the fiscal Quarter ending March 2021. Based on nine analysts’ forecasts, the consensus EPS forecast for the quarter is around $1.
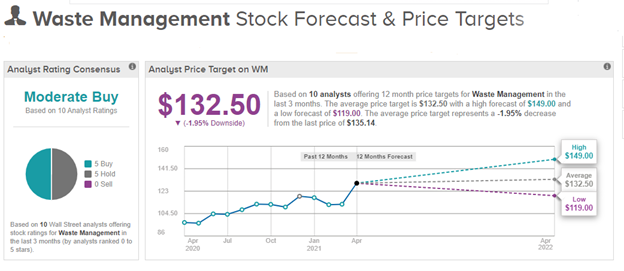
Based on 10 analysts offering 12-month price targets for WM in the last 3 months, the average price target is $132.50 with a high forecast of $149.00 and a low forecast of $119.00. The average price target represents a 2% decrease from the current price of $135.30. Power Traders like to see this wide divergence in opinion among analysts as it creates great trading opportunities when the artificial intelligence creates a trend forecast.
Over the last 52 weeks WM has traded as high as $136.35 and as low as $94.13. This provides us with an annual trading range of $42.22. When we divide this metric by 52 weeks, we can determine that the average weekly trading range for WM is roughly $.81. We refer to these as the commonsense metrics which we use as baseline measurements of understanding normal value. When using artificial intelligence, we look to amplify our returns based upon these baseline measurements.
What is unquestionable is that Waste Management has a powerful industry-leading position, a growing business, and continues to outperform the major market indexes. This accompanied by their growing dividend offer more than enough reasons to place this stock on your trading radar.
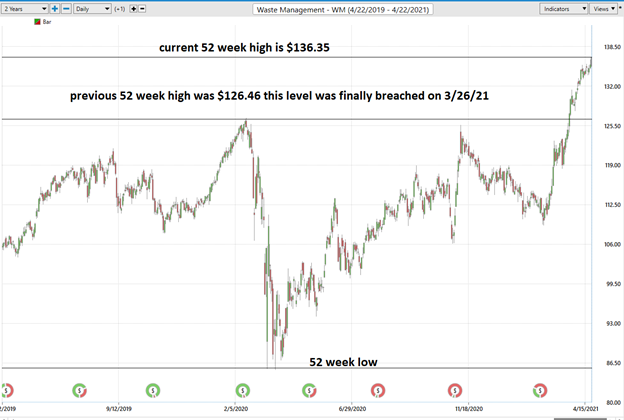
Whenever we trade, we always pay attention to where we are in relation to the 52-week trading range. It is very common to see the 52-week high provide very strong resistance to the market until it is breached. Often when the 52-week high is breached we will see the stock price explode higher very quickly over a very short period of time.
Here is the chart of WM over the past two years. Notice how until recently simply trading a breach of the 52-week high would see profits accumulate very quickly. Most recently WM encountered resistance at its most recent 52-week high.
Whenever we look at a stock forecast, we always are comparing what the stock has done, to the artificial intelligence, which is computing its forecast based upon a proprietary intermarket analysis of the most closely correlated assets as well as a neural network computation.
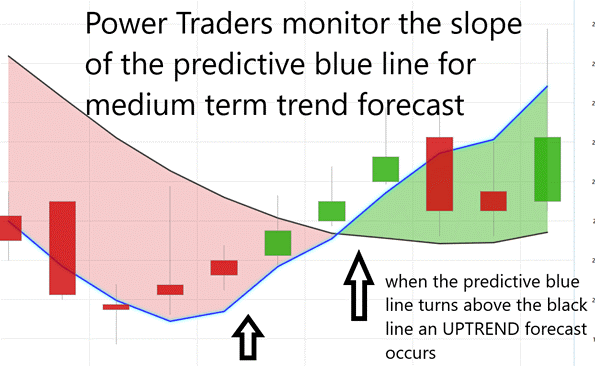
The key to the Vantagepoint analysis is the predictive blue line. The slope and general direction of the blue line determines the medium forecast for the market.
The Vantagepoint Software has three separate modules which create a forecast for a Power Trader. They are the predictive blue line, the Neural Net, and the Intermarket Analysis.
The software focuses on the daily price action. You’ll see that there’s a black line and also a blue line right up against the price data on the chart.
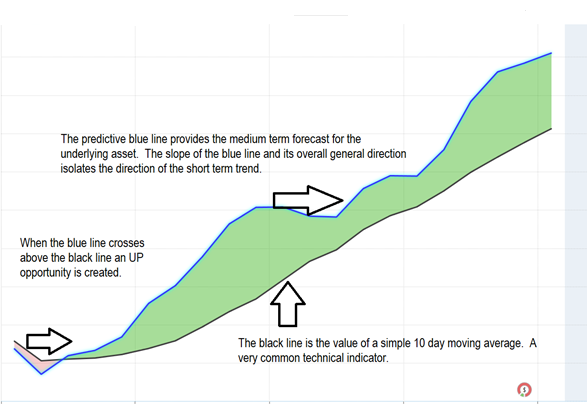
The black line that you see that is a regular simple 10 period moving average. A very common technical indicator. And it’s a good measure to go ahead and smooth out the price data and it gives us an indication of where market prices have been over a given period of time. But obviously as traders we really need to understand is where our market price is moving going forward.
So, what we want to do is compare the black line value on the chart to the predictive blue line, which is actually Vantagepoint’s predictive indicator. What it does is Vantagepoint is utilizing its technology to perform what’s called intermarket analysis. So that means that there’s known relationships as far as those neural networks are concerned that affect and drive the future price of Waste Management. That’s going to be things like the S&P 500 or the Russell 2000 or the NASDAQ. That’s going to be things like global currencies or global interest rates, or futures and commodity markets.
What is does is help shed light on those relationships and what’s driving the future price of the target market that you might be trading. It’s generating future price predictions of where prices are likely to move and utilizing those predictions and using them to construct these indicators that you see against the charts. So, turning what was a lagging tool (that’s really only summarizing past data and past closes of what’s already occurred in the market) into a forward-looking predictive tool.
So, whenever we have this blue line crossing above the black line its really suggesting average prices are expected to start moving higher and you therefore would likely look for long positions in the market.
The Vantagepoint AI Analysis
The predictive blue line also acts as value zone where in uptrends traders try to purchase the asset at or below the blue line.
In studying the WM chart above pay close attention to the relationship between the black line and predictive blue line. All that the black line tells you is what has occurred. It tells you where prices have been and what the average price over the last ten days has been. Your challenge now is to try and fine tune your entries so you can try to purchase at or below the predictive blue line in an uptrend.
The predictive blue line utilizes that Vantagepoint patented Neural Network and Intermarket Analysis to arrive at its value. It looks at the strongest price drivers of an asset through artificial intelligence and statistical correlations to determine its value.
Power traders use the predictive blue line in helping to determine both the value zone as well as the trend direction. F
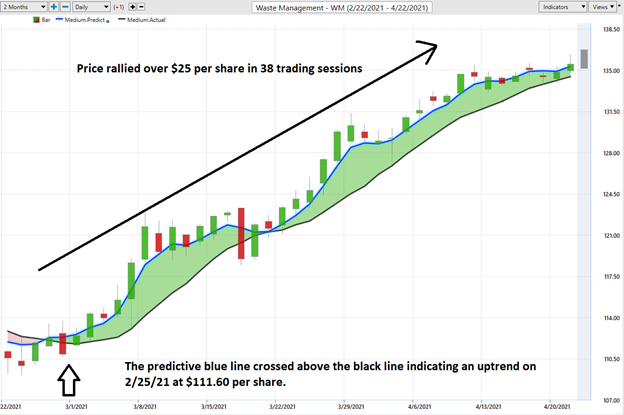
Observe how the SLOPE of the predictive blue line started moving higher a few days previous to its moving above the black line. Traders had numerous opportunities to purchase at or below the predictive blue line as prices rallied substantially higher in the next few weeks.
Fine Tuning Entries with The Neural Net Indicator
At the bottom of the chart is the Neural Network Indicator which predicts future strength and/or weakness in the market. When the Neural Net Indicator is Green it communicates strength. When the Neural Net is Red it is forecasting short term weakness in the market.
We advocate that Power Traders cross reference the chart with the predictive blue line and neural network indicator to create optimal entry and exit points.
Power Traders are always looking to apply both the neural network and A.I. to the markets to find statistically sound trading opportunities.
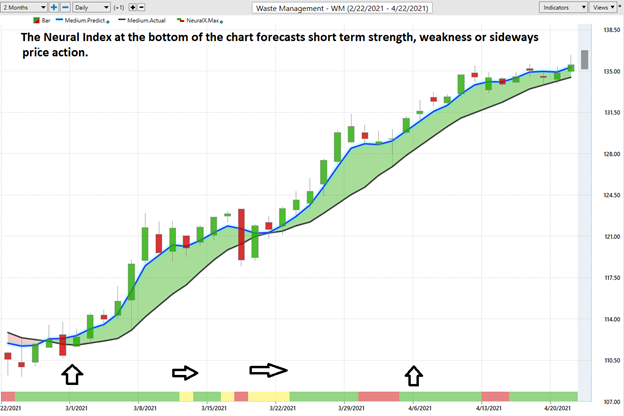
In summary, the trend turned up on 2/25/21. Prices have surged since that forecast and the trend remained firmly UP. Traders have had numerous opportunities to purchase WM lower on the lower end of the daily price forecast to fine tune their entries. Gains of 22%+ have been available to Power Traders who maintained positions throughout the entire trend cycle.
Daily Price Trading Range Forecast
And if you look at the very right-hand side of the chart, you’ll see that there is what we call a predicted shadow candle. And that’s actually a predicted high and a predicted low for the next trading day. So, you actually get an overall trend prediction, short-term strength, or weakness, and this predicted high and low. And what happens is you have these separate neural networks really doing all of this and looking at these different sorts of timeframes and creating a forward-looking analysis.
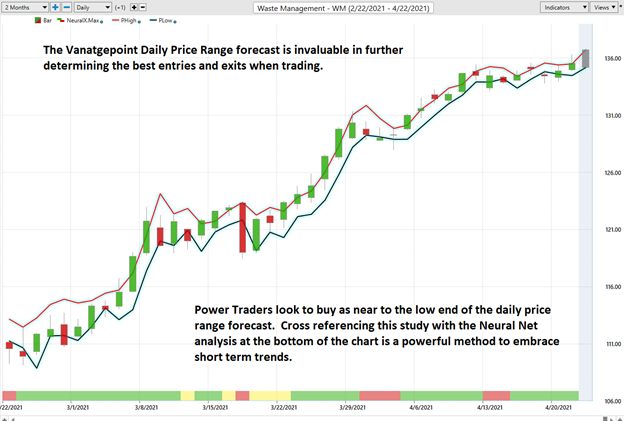
Power Traders try to use a price level below the predictive low price to place their protective sell stops in the market in case a sudden reversal was to occur. Observe how the predictive price low also provided numerous short term entry opportunities for traders to buy WM as it was trending higher.
Intermarket Analysis
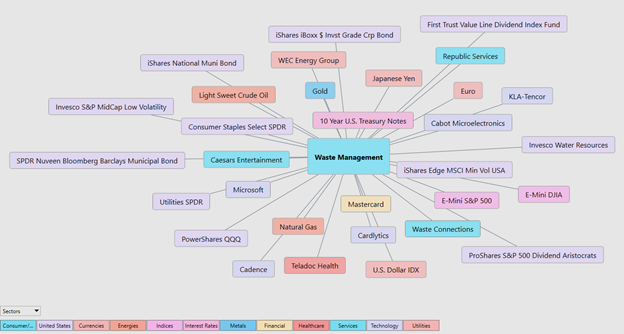
What makes Vantagepoint unique and distinct when compared to all other analytical tools is its patented and proprietary intermarket analysis.
Intermarket analysis is a method of analyzing markets by examining the correlations between different asset classes. In other words, what happens in one market could, and probably does, affect other markets, so a study of the relationship(s) is often very helpful to a trader.
Studying the charts can always provide objective realities in terms of locating support and resistance levels which become very clear on a chart. But we live in a global marketplace. Everything is interconnected. The billion-dollar question for traders is always what are the key drivers of price for the underlying asset that I am trading?
These intangibles are invisible to the naked eye yet are responsible for driving prices. These markets show very high statistical correlations.
Instead of looking at financial markets or asset classes on an individual basis, intermarket analysis looks at several strongly correlated markets, or asset classes, such as other stocks, currencies, ETF’s, and commodities. This type of analysis expands on simply looking at each individual market or asset in isolation by also looking at other markets or assets that have a strong relationship to the market or asset being considered. The Vantagepoint software analyzes the top 31 drivers of an assets price. This analysis will often show ETF’s which are big owners of the underlying asset, but it will also uncover other markets which are statistically correlated to the trend you are analyzing. Traders often find other blossoming opportunities when engaging in Intermarket Analysis.
There is great value to be had in studying and understanding the key drivers of WM price action.
Our suggestion – The consensus of analyst’s opinions shows that WM is fairly valued around $135. The high-end estimate over the short term is $149. We think the 52-week high at $135.46 will provide short term resistance to the current advance. However, we do think that as long as the UP forecast remains in place that purchasing weakness in this market will prove to be rewarding. Longer term we estimate that we will surpass the higher end of the analysts estimates at $149. Power traders are in at lower prices and are placing their protective stops below the bottom of the predictive low channel. WM could be a great swing trading stock. The next earnings call on 4/27/21 may act as a spark for greater volatility and we like the idea of purchasing WM at lower levels.
We have it firmly on the radar and look for opportunities during weakness as long as the A.I. forecasts UP.
Our advice: Follow the A.I. trend analysis, pay close attention to the daily price range forecast, and look for opportunities at the lower end of the range. Practice good money management on all of your trades. WM deserves to be on your trading radar.
Let’s Be Careful Out There!
Remember, It’s Not Magic.
It’s Machine Learning.

IMPORTANT NOTICE!
THERE IS SUBSTANTIAL RISK OF LOSS ASSOCIATED WITH TRADING. ONLY RISK CAPITAL SHOULD BE USED TO TRADE. TRADING STOCKS, FUTURES, OPTIONS, FOREX, AND ETFs IS NOT SUITABLE FOR EVERYONE.
DISCLAIMER: STOCKS, FUTURES, OPTIONS, ETFs AND CURRENCY TRADING ALL HAVE LARGE POTENTIAL REWARDS, BUT THEY ALSO HAVE LARGE POTENTIAL RISK. YOU MUST BE AWARE OF THE RISKS AND BE WILLING TO ACCEPT THEM IN ORDER TO INVEST IN THESE MARKETS. DON’T TRADE WITH MONEY YOU CAN’T AFFORD TO LOSE. THIS ARTICLE AND WEBSITE IS NEITHER A SOLICITATION NOR AN OFFER TO BUY/SELL FUTURES, OPTIONS, STOCKS, OR CURRENCIES. NO REPRESENTATION IS BEING MADE THAT ANY ACCOUNT WILL OR IS LIKELY TO ACHIEVE PROFITS OR LOSSES SIMILAR TO THOSE DISCUSSED ON THIS ARTICLE OR WEBSITE. THE PAST PERFORMANCE OF ANY TRADING SYSTEM OR METHODOLOGY IS NOT NECESSARILY INDICATIVE OF FUTURE RESULTS. CFTC RULE 4.41 – HYPOTHETICAL OR SIMULATED PERFORMANCE RESULTS HAVE CERTAIN LIMITATIONS. UNLIKE AN ACTUAL PERFORMANCE RECORD, SIMULATED RESULTS DO NOT REPRESENT ACTUAL TRADING. ALSO, SINCE THE TRADES HAVE NOT BEEN EXECUTED, THE RESULTS MAY HAVE UNDER-OR-OVER COMPENSATED FOR THE IMPACT, IF ANY, OF CERTAIN MARKET FACTORS, SUCH AS LACK OF LIQUIDITY. SIMULATED TRADING PROGRAMS IN GENERAL ARE ALSO SUBJECT TO THE FACT THAT THEY ARE DESIGNED WITH THE BENEFIT OF HINDSIGHT. NO REPRESENTATION IS BEING MADE THAT ANY ACCOUNT WILL OR IS LIKELY TO ACHIEVE PROFIT OR LOSSES SIMILAR TO THOSE SHOWN.

