

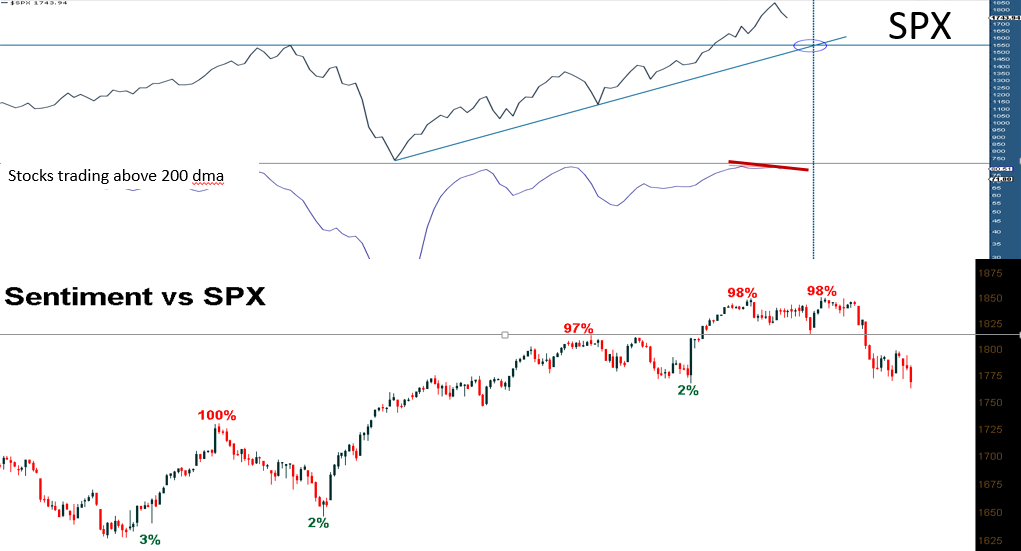
Over the last couple of months, I have repeatedly said that this market was not as strong as it appears to be. The fractured structure of the indexes with the Dow failing to make new highs as the other indexes were —was a warning sign. But there was another warning sign that has been in place since July of 2013. That was the divergence between stocks trading above their 200 daily moving average (DMA) and the indexes making new highs.
The chart below shows this divergence and it is something you must take seriously. Are we going to see a stock market crash? I don’t think so, but that is very hard to predict. But I do think we are going to see lower levels before this ends and an intermediate term top is in place. 1550 would be roughly 300 points from the highs on the SPX and that has been my target zone for a while. I still believe we will get there
But if you blindly jump short with that 1550 target in mind, you will have a tough road in the coming months. When the markets are dropping, volatility rises. This opens the door for something we have not seen in a long time. The chance to trade both the long and short side and make money. But to be able to make money on both sides, it is vital to follow sentiment levels.
History has showed us that important highs and lows are typically made at sentiment extremes. Even though I believe we will see the SPX trading at the 1550 level, we are going to experience bearish sentiment extremes. When smart money will be buying at bearish sentiment extremes, combined with shorts getting squeezed, seeing the SPX 50-75 points in days will be normal.
= = =
To see where the current sentiment levels are now-click here

