I’m a big fan of divergences in my work. A negative divergence occurs when an indicator fails to make a new high as the price index is printing new highs and is found at market tops. A positive divergence occurs when an indicator fails to print a new low as the price index is printing new lows and is found at market bottoms.
VERSATILE
Divergences can be found using all sorts of indicators. Unfortunately, a divergence in any indicator always has the risk that it will disappear as the indicator plays ‘catch-up’ to price. For this reason they cannot be used in isolation.
HISTORY SHOWS US
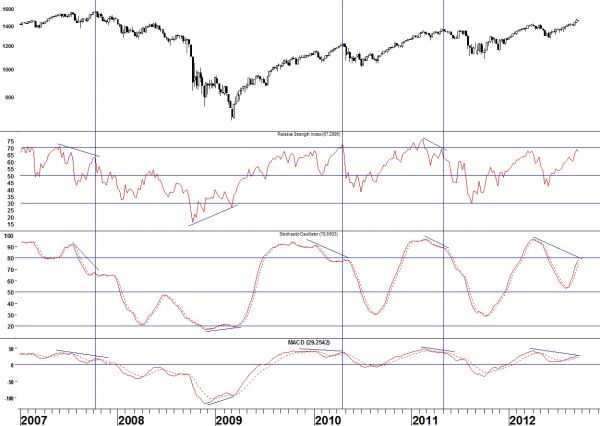
Looking at the big picture, the chart below is a weekly chart of the S&P 500. The price index is in the top window followed by 14-day Relative Strength, the Stochastic Oscillator, and MACD (moving average, convergence divergence) in the bottom window. Note how positive divergences have preceded market bottoms in the past and negative divergences have preceded market tops.
You may have noticed that, currently, despite negative divergences in stochastics and MACD, Relative Strength is not showing a divergence. However, look closely and you’ll see something more is happening here. Notice that at past market tops (even in April 2010 when there was no divergence) Relative Strength has been able to push above 70. That’s not happening now despite new highs in the S&P index. That is a negative divergence, too!

IS A TOP COMING?
These divergences in the weekly chart are a reason to start looking more closely at your daily charts. If your daily charts are telling you a top is coming, the weeklies could be telling you to expect more than just a short-term correction.
[Editor’s note: Check out Carlson’s website for a 30-day trial offer. ]


