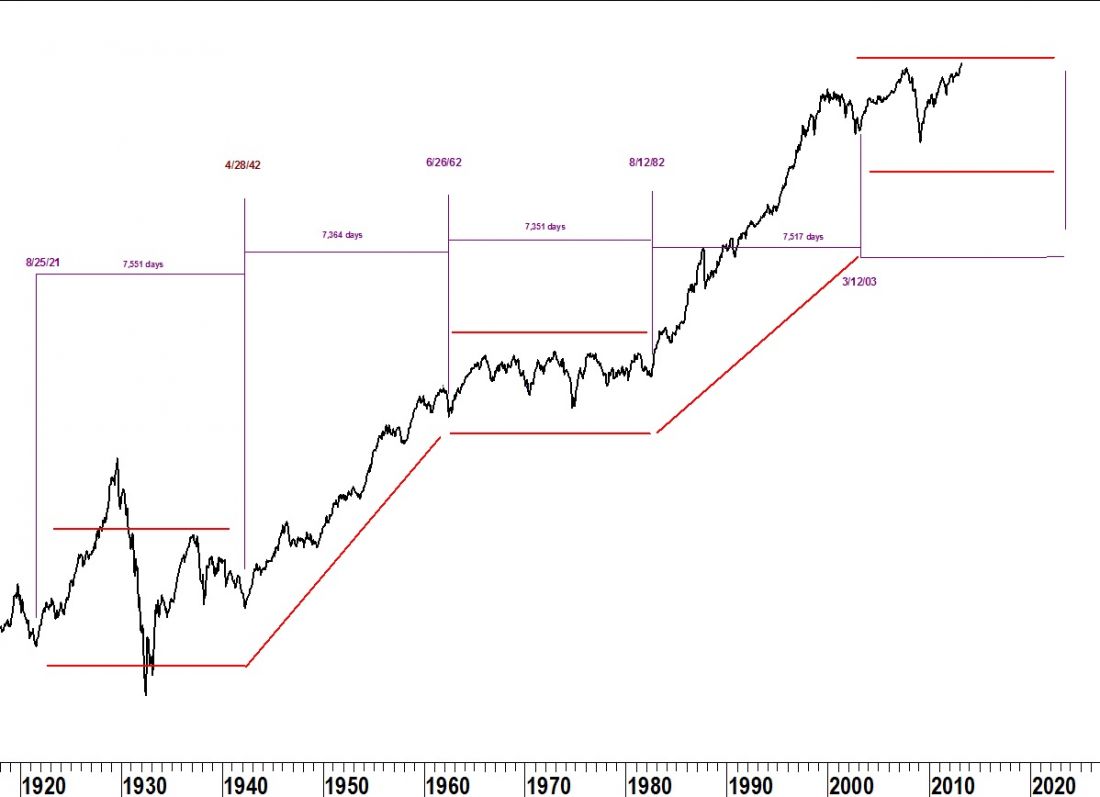
Chances are you have seen a long-term chart of the Dow annotated as the chart below has been. The red hash marks designate secular bull and bear markets.
But if you look closely, you may notice one significant difference from similar charts; the first secular market begins in 1921 and not in 1932 as is often shown.

Why the low in 1921? Why is the secondary low of March 2003 used and not the nominal low in October 2002? The dates shown on this chart are the lows of, what George Lindsay called, the Long Cycle and were found using very specific, rules-based methods devised by him.
These rules are explained in the book An Aid to Timing. I recently took a moment to count the exact length of these long-cycles. Although Lindsay devised these methods using data he had collected back to 1798, he wrote the original An Aid to Timing in 1950 so he wasn’t able to do perform this exercise for our “modern” market. Review the table below and notice how similar the four cycles are in duration.
Regardless of the time period chosen, the long cycle which began in 2003 is not expected to bottom until 2023. This should eliminate any question of whether the Dow began a new secular bull market at the low in March 2009.
8/25/21 – 4/28/42 = 7,551 days
4/28/42 – 6/26/62 = 7,364 days
6/26/62 – 8/12/82 = 7,351 days
8/1/82 – 3/12/03 = 7,517 days


