

I do like 3D Systems Corporation (DDD).
I’ve talked about this stock before, as well as the implications and the benefits of a potential 3-D printing machine. This stock has had such a buzz about it for so long. The gorgeous high wave doji on May 14th, 2013, caused the massive bullish sentiment to taper off for a few months. This period is also known as a distribution phase. Many of my students were selling covered calls on their stock positions during this time. The public participation phase of the DDD move was during May from $35.00 – $50.00
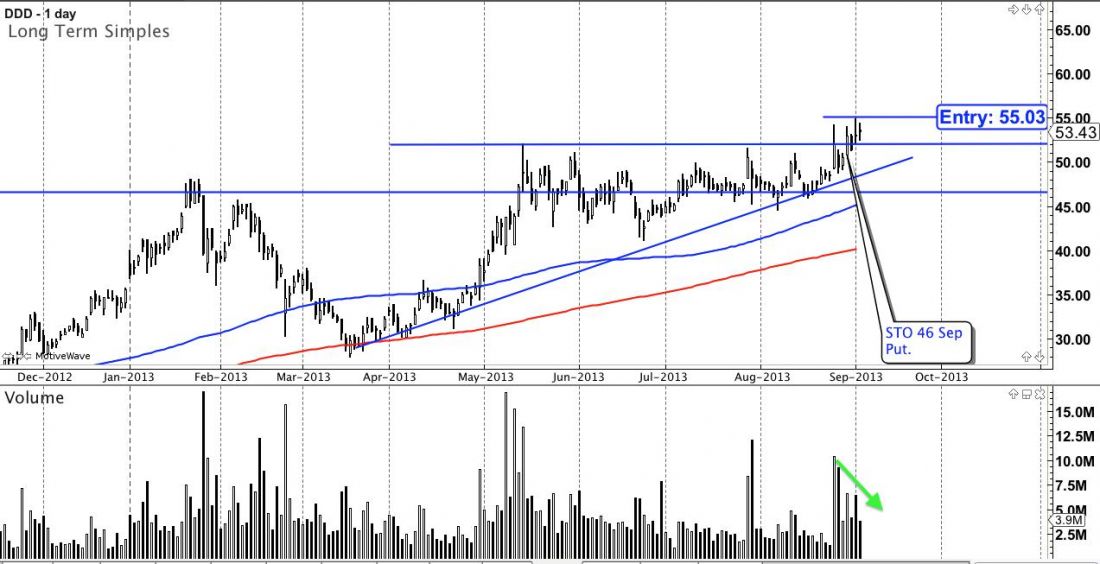
As far as a trade is concerned, DDD looks really exciting. Volume has declined over the last few days. Additionally, the stock has had higher lows and relatively similar highs. A pennant pattern appears to be forming, which is a continuation pattern. It also appears the bullish pressure is building. With the Dow Jones and Nasdaq finding a potential support recently, this stock could really pop.
TRADING OPTIONS
There are a few ways to play it, especially if you’re familiar with options. Obviously, one could go long the stock. If a trader wanted to own shares of DDD but didn’t want to pay the current market price, in case the stock does pull back, one could sell a naked put, if you wanted to buy 100 shares or more. Selling four contracts means you would be interested in 400 shares. I usually encourage selling puts below or around a support level. So, if you are put the stock around that area, the stock has the potential to bounce. Some students did this a few days back, selling the $46.00 puts with the September expiration. I still think there is plenty of time on the trade. Let theta, in regards to selling options, do its job!
LONGER TERM PLAY
If you wish to buy an option, I would suggest a longer term option. These are called LEAPS, which is an option with more than 9 months to expiration. DDD could absolutely run to the moon.
However, there is also a chance, and a good one, that this current resistance level will become a support in the future, as a breakout retest of this potential ascending triangle; old resistance, new support. The breakout of this move is expected to be about $15.00, which is the size of the ascending triangles initial range (Late April to Mid May). I’m excited about this trade and expecting students, as always, to trade their plans!
= = =
[Got questions on options? Newsome is an expert. Post a comment below.]

