

The head and shoulders top, coils, ascending triangles, descending triangles, wedges, and last but not least…scallops. There are a large number of patterns that the technical analyst uses to define particular setups in price action that he can act upon and trade with a favorable risk to reward.
Many are common, with varying names, some are more rare, and less known, such as the scallops, initially brought to my attention by Technical Analysis of Stock Trends by Edwards and Magee. The market has been around longer than any of us currently reading this, and yet through thick and thin, and all the economic changes, this pattern has stuck around, and the implications and process behind it have changed the slightest, if at all.
The scallop pattern is often interchanged with the rounding bottom or cup and handle. The reason for this is because the scallops are traditionally sequential rounding bottoms with slightly higher prices. Nevertheless, we treat them as Edwards & Magee would have and name them the scallops. The reason behind the pattern’s development should be pretty obvious if we are familiar with support and demand. Regardless, let’s discuss the pattern’s formation with the example of BlackBerry (BBRY) as seen in Figure 1.
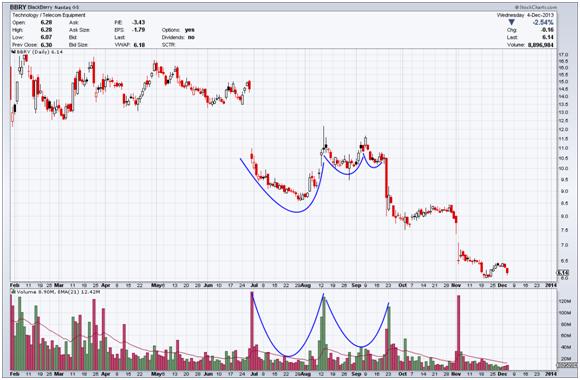
Looking back to the beginning of July ’13 we see that BlackBerry gapped down on a bad earnings report. However, after a few weeks we saw the pattern begin to round out. The reason for this is that the battle between both buyers and sellers begins to even out. After what appears to be a steep continuation after the gap, the decline slowed, and prices rounded out as the sellers lost power, and the bulls stepped in to pick up the slack. Throughout the two completed scallops, you’ll notice that the volume has a similar shape to the rounding in the price action as well. This is a key feature, and required, for it to truly be classified as a scallop(s). Demand slightly began to outpace the supply, driving prices higher and higher until the right hand side of the scallop came to a level identical to that of the left side where it began. Following this, another smaller, shallower scallop develops, with the same volume characteristic, and the same upper levels.
The implications of this pattern are typically bullish, and one can expect bullish price movement as early as halfway through the pattern once the rounded shape has been confirmed. As we see in the BBRY pattern, the pattern failed, and when that occurs the failure can be dramatic just as a head and shoulders. Let’s take another look at a scallop pattern in Fossil, Figure 2.
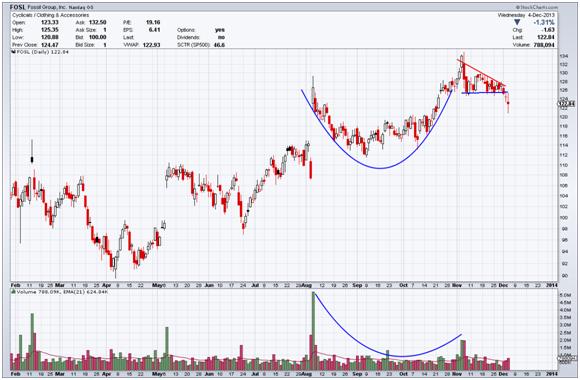
We can see the rounding pattern around mid-September to early October in Fossil (FOSL), and the same volume characteristic of a battle between the bulls and bears confirming this as a scallop for us, and possibly giving the savvy investor a signal he may want to follow. We can see as it rounds out, the bulls slowly gain power. An entry anywhere in this area, would have provided a very handsome profit, in a very short amount of time. Generally, we can expect that the deeper the rounding out of the scallop, the shorter in duration the pattern will turn out to be as can clearly be seen by our two examples here.
Scallops have a large advantage over other patterns, because it offers two potential times to enter a trade, one earlier, and one later, depending on the trader’s risk preferences. The setup and way to play this pattern is very simple. After you have identified the rounding of the price action and volume, you can establish a long position with a stop set to your preference or just below the low of the entire pattern. The alternative is to wait for a breakout above the high of the pattern (the beginning left side of the scallop(s)), and set your entry and stop based upon that level.
As suggested by Edwards & Magee, waiting for a breakout with significant volume and a move of 2%-3% is advisable. In this instance I find it best to initiate a half position on a breakout, and another half on a pullback. However, more often than not this pattern is early and easily identified and I enter as soon as the rounding pattern shows with volume. Only when the pattern is skeptical or the stock has strange behavior do I wait for a breakout. As you can see with our examples, even though the bullish-ness of the patterns failed, an early entry into the rounding pattern would still have proven profitable. If you would like to learn more information about this pattern, I would suggest reading the information suggested in the references section.
= = =
Read more of Eyerly’s work here on his blog.
References
Edwards, Robert D., John Magee, and W. H. C Bassetti. Technical Analysis of Stock Trends. 9th ed. Boca Raton: CRC, 2007. Print.
The Pattern Site. Thomas Bulkowski, n.d. Web. 4 Dec. 2013.

