
Adding a New Commentary PostAdding a New Commentary Post
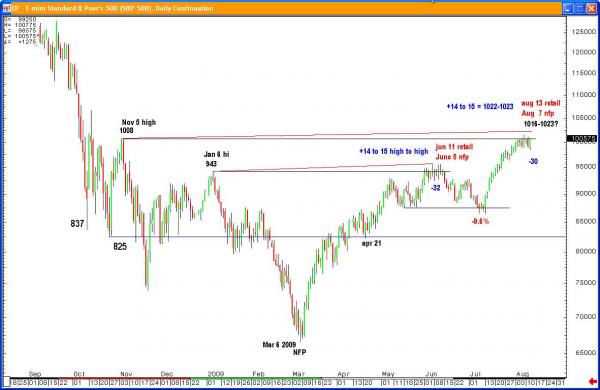
The chart above shows the Aug 7 NFP high to be highly correlated to the June 5 NFP high. Event risks are almost the same, with a retail sales report following the NFP announcements. Retail sales for May were positive, and retail sales for
July are expected to be positive due to “cash-for-clunkers.” The only point of distinction as regards event risks is today’s FOMC announcement due out this afternoon.
Adding a New Commentary Post
Several observations need to be made. First, the June 5-11 highs were roughly 14 to 15 points above the high at 943. Second, the initial decline off the June NFP was 32 points. The initial decline off the Aug NFP report was 30 points. After the 32 point decline in June, the stock market walked back up into the retail sales report. After the 30 point decline following the Aug NFP report, the stock market has walked back up to the November 5 election high of 1008. The correlation remains high, and the resolution in June was to swoon.
The window between the June 5 NFP report and the June 11 retail sales report allowed traders and investors to sell the SP500 above the Jan 6 high. Now we are seeing the same opportunity for traders and investors to sell the SP500 above the 1008 election high up to roughly 1023. The Aug NFP high is thus far 1016. What we are looking for in this Aug 7 to August 11 time window are trade setups to get short the market above 1008, ideally between 1016-1023. If there is a close above the NFP high at 1016, this would be a signal the correlation is not working. Short of that, it looks like downside risks are beginning to outweigh upside risks for the balance of the 3rd qtr. Be prepared for a potential September swoon to follow a June swoon.

