
Oh no, not again.
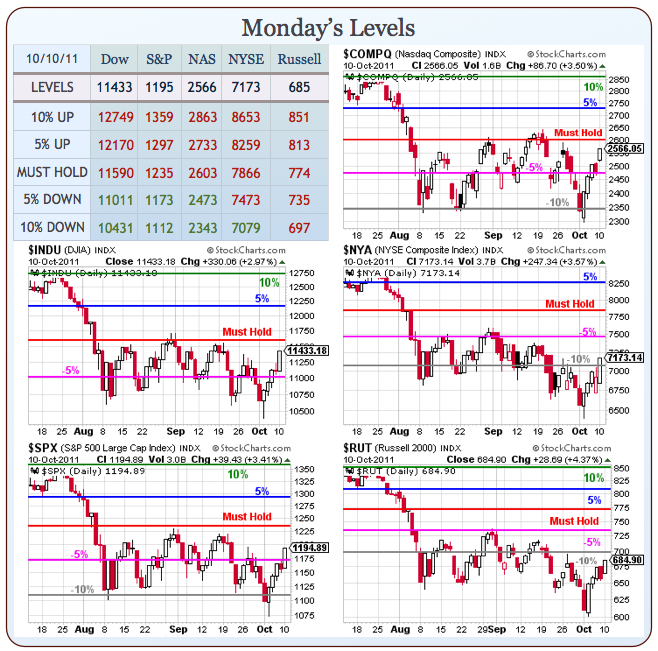
It’s already time to hedge to the downside (actually, it was yesterday and we did) as we once again test our Must Hold levels at Dow 11,590, S&P 1,235 and Nasdaq 2,603 but it’s that 1,200 line on the S&P that has given us our first sign of trouble – again and again and again this summer.
You know what they say: “Fool me once betting the S&P keeps rallying over 1,200, shame on you – fool me 5 times since August first and just call me a perpetual bag-holder.” Our choice of hedge in our Live from Las Vegas Member Chat yesterday (and thanks to all who attended for a totally great weekend!) was my 2:12 comment:
SDS Oct $22/23 bull call spread is .87 in the money at net .42. That makes 150% if the S&P doesn’t hold up here. Of course stop out if S&P makes 1,200 but otherwise good weekend protection with stop at .22 so $420, risks $200 to make $580.
 We spent much of the weekend at our first annual (and it’s going to be at least annual as it was too much fun not to do again) PSW Investing Conference talking about balance and hedging and trading our ranges – nothing we don’t discuss day in and day out on the site but there’s a really nice dynamic of having the group discussions…
Anyway, the short story is that, after seeing the S&P fail at the 1,200 level 5 times in 8 weeks, we take the opportunity of another run-up to take a short position that should pay 138% (I was estimating in the live chat) if the S&P does what it did the last 5 times and heads to the bottom of its range again (where we will be happy to go long while others are panicking – again for the 6th time!
As you can see from Doug Short’s S&P chart above, we’re in a very critical resistance zone for the S&P 500 as it tries to break out of the downtrending channel we’ve been tracking since the collapse began in late July, when we fell from 1,350 on July 22nd to 1,100 on August 8th (25.9%) while the Dollar rose from 73.50 to 79.80 (8.8%). So, in order to get a clearer picture of the technicals – we need to…

