

When the classic Market Profile(C) methodology was introduced to the public in 1985-86, the intent was to evaluate market value/price in a vertical Gaussian distribution moving through time and activity horizontally.
A LITTLE BACKGROUND
The classic Market Profile(C) combined time, price and opportunity in one display, and more importantly was based on raw data. As the Market Profile(C) matured volume was included in the vertical Gaussian distribution. As such, it represented an actual structure of market participant activity, not a calculated ex-post lagging indicators.
The modern Time Price Volume (TPV) Market Profile(C) displays market activity as it is actually happening. Reality versus perception is what it is all about, or what it should be about in our quest for market based information.
The 321 Methodology Model developed over two decades focuses on trader motivations and sentiment as seen through the skewing of volume in the Market Profile(C). Research has shown high volume and low volume numbers stopped or attracted activity, and how the days or preceding days’ numbers in the distribution could be used to get within one tick of the rotational highs or lows. The 321 Methodology states that there are three important factors actually driving the markets that are quantitative, timely that can improve one’s trading results.
321 METHODOLOGY
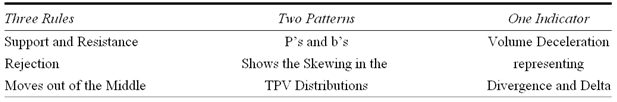
The 321 Methodology is best described as three rules, two patterns and one indicator. This methodology focuses on volume movement through the distributions and the interplay of such with different timeframes. The table below provides the guideline to establish support and resistance levels and engage in the market:
THE RULES
Rule 1. In commercial or hedge markets, low volume numbers are support and resistance – they stop activity – and should be traded as such.
Rule 2. High Volume areas represent value and are attractors. They serve as support and resistance the first time touched only. If not immediately rejected, you can expect to trade around the high volume numbers for one to two hours.
Rule 3. Don’t fade Moves out of the Middle (MoMs). New moves start when the market has come into balance, off the Balance Point, Point of Control, or Mode.
Pattern 1. A capital “P” pattern represented in a statistical distribution shows indicates a retest of resistance and/or higher prices.
Pattern 2. A lower case “b” pattern represented in a statistical distribution indicates a retest of support and/or lower prices.
Indicator 1. As the markets move higher or lower, eventually the buying and selling interest disappears. Markets go up until the last buyer has bought, and vice versa for selling. Volume deceleration in market activity, represented in volume signals that it is time to take the trade when in proximity to the current or historical high and low volume numbers.
321 MODEL
When combining the 321 Methodology with the Model, which uses a statistical distributions in a Market Profile(C) format, One can see how volume develops in the distribution. The test and retest of support and resistance based on volume in the distributions reveals trader and or investor motivations. When comparing the defined TPV statistical distributions with the salient timeframes that drive the market internally the markets directional bias becomes clear.
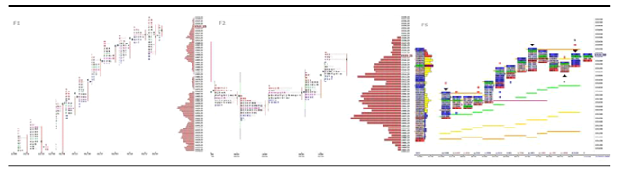
CONCLUSION
The combined 321 Methodology Model allows for enhanced and efficient analysis, trading or investment decisions. By using the modern TPV Market Profile(C) the directional movement of volume can be used as a proxy for trader and or investor motivations. What really matters is the movement of volume within the distributions for the timeframe selected. This yields the next most likely directional move in the market.
Get the market’s direction right, and everything else falls into place. Good trading.

