
As we go through the charts of the daily indexes and individual names we see a lot of Pullback Off Lows (POL) patterns emerging. Much like in uptrending markets Pullback Off Highs (POH) patterns are the only pattern you need to know the opposite applies in downtrending markets where POL patterns are all you need to know for shorting. Those POL’s are also the what to watch out for if you are long. That all said below are the daily charts of the indexes.


As you can see from a daily chart perspective each of the above has broken the Pink POL, Snapback rally, D wave, Bear channel call it what you will to the downside. Does that automatically mean this is it? Meaning a retest of recent lows? No, at this point all it means is that its initially broken to the downside and it’s all about follow through from here. We’ll take it a step at a time as usual.
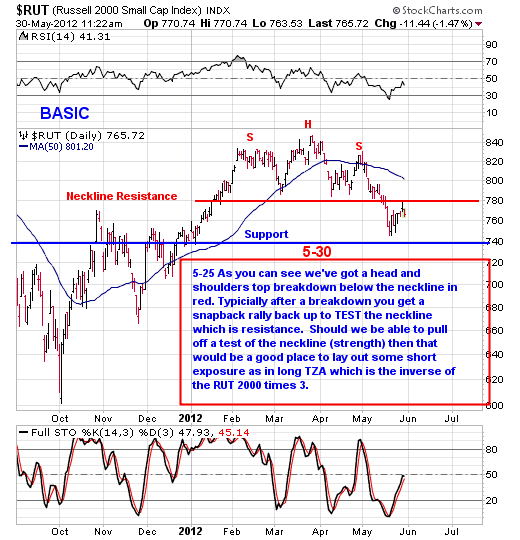
The Russell 2000 shown below tagged its neckline (resistance) of its head and shoulders top and one could say and rolled right back over.
This all said? So far so good.
Now let’s take a look at HIBB. It triggered a short sell trade today by breaking below the pink POL channel. The notes in the chart say it all.

To learn more, sign up for our free newsletter.

