

One of the most valuable trading secrets I’ve come to appreciate in recent years is the five- percent day. A trading session qualifies as a five percent day whenever the entire day’s price range is established during the first sixty minutes of trading. On average, five-percent day sessions occur five percent of the time, hence the name. Technically, a disciplined trader could make a good living scanning for and exclusively trading five-percent day setups, while spending the rest of his/her time gardening and preserving capital.
A five-percent day signal usually lasts two to three days and calls for going either long or short, depending on the direction of the breakout. If price breaks out upward from the five-percent day‘s range, the trader buys. On the other hand, if it breaks out downward, the trader sells or goes short.
In the last twelve months, AAPL has had more than its fair share of five percent days, the most notable of which occurred on October 21st, as depicted in chart 1 below. Since then, shares have appreciated by a whopping twenty percent in just five short weeks. Moreover, uncharacteristic of five-percent days, as many as six additional occurrences have been recorded since, namely, on October 24th/31st and November 5th/7th/21st/28th.
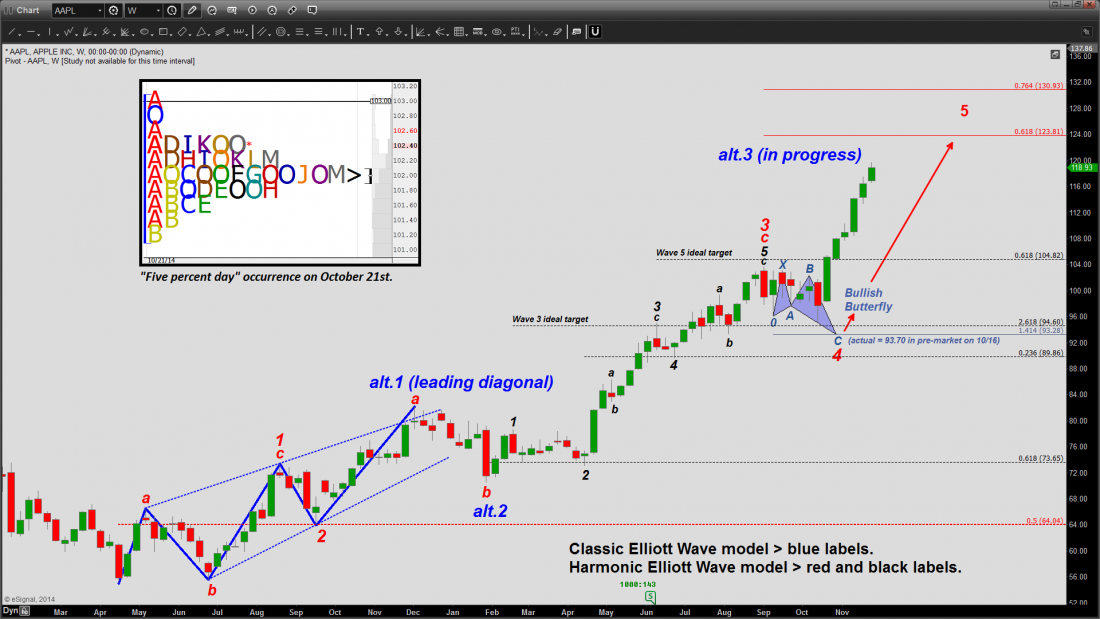
Chart 1. AAPL’s wave progression off the mid-2013 bottom. A five percent day on October 21st ushered in a breathtaking run.
Elliott Wave Count
As far as the Elliott wave structure is concerned, I’m tracking its progress using two competing models: the “classic” R.N. Elliott model (blue labels) and the relatively new “harmonic” model developed by Ian Copsey (red and black labels). The two models are pretty similar except that in the latter, the author posits that within a five-wave structure, waves 1, 3 and 5 each subdivide into a-b-c zigzag structures, not smaller 5-wave structures as postulated in the classic model. I can’t wait to see which model wins out here!
Now let’s compute AAPL‘s upside potential based on the Elliott chart patterns at hand. First, proponents of the “classic” model should note the leading diagonal in the blue wave 1 position. According to the model’s guidelines, whenever wave 1 unfolds as a leading diagonal, wave 3 should be exceptionally powerful. Hence, my “classic” model forecast calls for blue wave 3 to stay on track until it reaches a size of 2.618-2.764 x blue wave 1 (i.e., 141.58 to 145.54) for reasons articulated further down.
As for the “harmonic” model, the structure is suggesting that red wave 5 is currently underway and should reach an ideal target of ~124 to ~131. Per the model’s guidelines, the two most common fifth-wave targets are obtained by respectively multiplying the total distance measured from the bottom of red wave 1 to the top of red wave 3 by 0.618 and 0.764, and then projecting the two results from the bottom of red wave 4. However, fifth waves are known to occasionally extend, making a higher target easily attainable. One more thing: red wave 5, just like red waves 1 and 3 before it, must also subdivide into an a-b-c zigzag for the overall structure to remain true to the model’s guidelines.
More Chart Patterns in Play
It is no secret that what has unfolded on AAPL‘s weekly chart during the last two years is a massive Cup and Handle pattern whose hundred percent target lies near 152. This is depicted in chart 2 below. Also in play is a “textbook” AB = CD harmonic pattern (orange labels). In order to achieve equality with the AB leg, the CD leg must reach 144.56. Moreover, since the BC leg retraced 50 percent of the AB leg, the 2 x BC projection must converge onto the AB = CD price level to form a tight PRZ (i.e., Potential Reversal Zone). As shown in the chart, the 2 x BC projection lies at 146.53, within two points of the AB = CD price level. That’s one pretty tight PRZ! Hence, if the unfolding Elliott wave count is correct, blue wave 3 should simultaneously fulfill the upside objectives of both chart patterns: the Cup and Handle and the AB = CD harmonic.
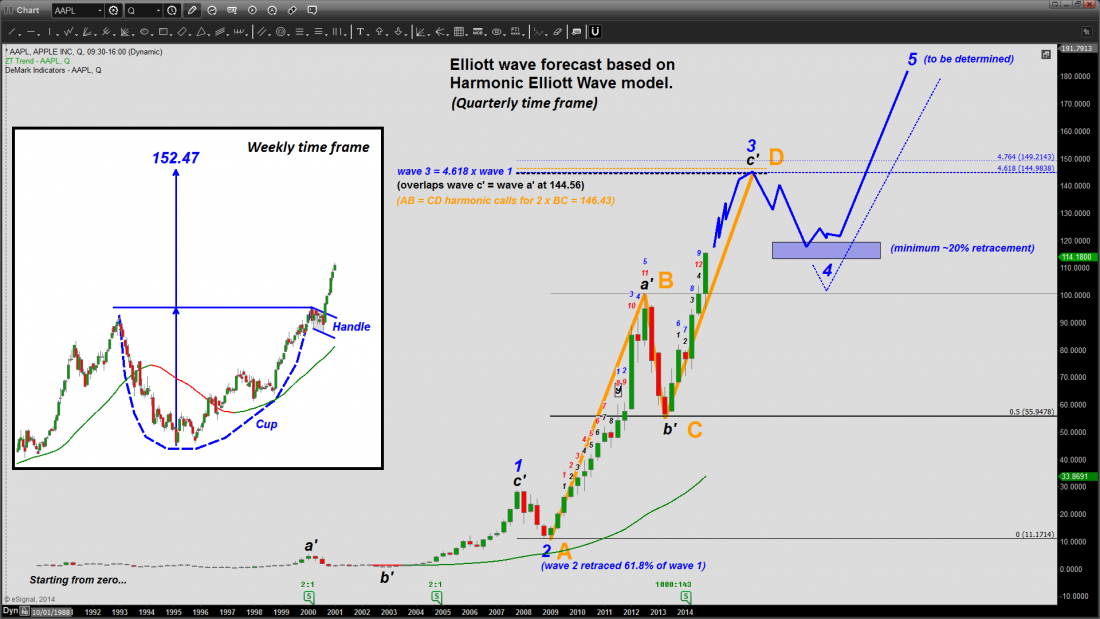
Chart 2. Multiple chart patterns appear to be converging onto the mid-to-high 140’s (give or take a couple of points).
Finally, should the price action continue to unfold as indicated, blue waves 4 and 5 will be the topic of a future article.
#####
For more trading tips from Peter Ghostine, please click here.

