

George Lindsay described his 22-Year Overlay in a two part installment of his newsletter in 1964. In it, he showed 18 examples of how the model had helped to time highs in the Dow. In the 22-Year Overlay, we are searching for three important intervals ending at a high 22 years (22y), 15 years (15y), and eight years (8y) later. Lows appear every seven years (7y) followed by a high 8y after the final low.
Some of the highs he showed were significant and some were not. The significance of the forecast can be predetermined by the significance of the 22y and 15y interval lows. The significance of the 8y interval does not affect the expected decline.
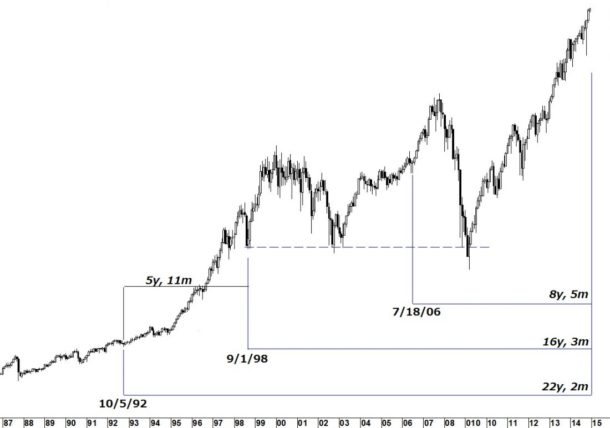
In the current set-up, the origin of the 22y interval in 1992 can be seen on the chart at left but doesn’t look like an important low. I believe that is the wrong interpretation. This low was point G of Lindsay’s long cycle (See An Aid to Timing, SeattleTA Press 2012), defining it as an important low. More important to determining the importance of the forecast high is the significance of origin of the 15y interval. The low in 1998 was the low of the separating decline of a three peaks/domed house pattern. Lows of separating declines have proven to be very important in forecasting 15y highs throughout Lindsay’s work.
Normally, one bear market holds above the nadir of the previous one. There have been only a limited number of exceptions to this rule. On these few occasions, the length of the 15y interval has come closer to 16y than 15y. The low in 2009 breached the previous two lows in 1998 and 2002. Last week’s high in the Dow is 16y, 3m from the low in 1998.
Lindsay wrote that when the 15y interval is increased to 16y that the distance between the 22y and 16y lows comes closer to 6y than the prescribed 7y. As expected, the distance between the lows in 1992 and 1998 is almost exactly 6 years.
#####
To get your copy of the November Lindsay Report, click here.

