I think it’s helpful at the beginning of the idea to break trading into two parts. The first being the idea of what you think a stock will do based on its previous daily performance, performance of the market and performance of the sector.
For example, I want to be long $HIG, because the financial sector has been the strongest sector over the last month and this is a strong stock on the daily.
(The Hartford Financial Services Group, Inc., through its subsidiaries, provides insurance and financial services in the United States and internationally.)

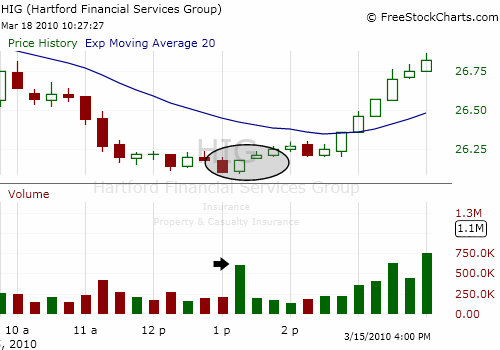
Ellipse illustrates the days covered in the 15minute charts below.
On Friday 3/12, $HIG sold off from its monthly highs 93c, closing near its lows on light volume. Monday, it continued to sell off in the morning. However, using the higher time frame of the daily, you know there have been buyers attracted to the stock. So you wait for it to sell off until it hits the level that brings the buyers back.
It finally hits a swing low at 1:15pm. Take a look at that volume candle. It measures 600K and dwarfs any of the days proceeding candles. The largest that day was 400k. The stock trended higher for the rest of the day, never approaching the lows again.
So the idea is that $HIG is going to continue up after the day and half of selling. The trade then takes place where you monitor it for some indication that price level has hit a point that the buyer’s will overwhelm the sellers and push this back up. This came with spike in volume with a 15 minute candle energy candle to the upside.
On Tuesday, I came in with the same idea. There was buying into the close. $HIG opened near it’s high’s, but then immediately sold off. Keeping the same idea of going long, I was trying to anticipate where the buyers would come in and form support. As it came down from the high of $26.80. I was looking at the 20 EMA on the 15 minute chart, which was at $26.49. The market was having an up day, so I thought with all the buying at the end of the day this had some more room to go up and would have to stop.
Anticipating can be difficult, because the danger is you are totally wrong and it runs right through your bid. The upside is if you are right, you have a great entry price and great place to manage your risk. The key is if you are wrong to know where you are going to get out. So for this example I set my bid at $26.51 with an out at $26.39 if I was wrong.
$HIG ended up pushing through this level to $26.46, which was the low for the day. Enough buying came into support the stock at this level, but it wasn’t until 12pm that it began to rally and make new highs.

Ellipse shows the swing low off the 20EMA and the push above the opening range.
It gaps up Wednesday on news it would pay back TARP. It then sold off at the end of the day with the rest of the market to the middle of its range. My idea is that is still that it is a long and will continue to trade it that way until something happens to change my opinion.
Tagged: day trading, day trading stocks, day trading swing trading prop firms, equity trading, HIG, online stock trading, proprietary trading firms, stock trading, TRADING STOCKS


