

Counts are lining up for the next tradable top in the Dow near Dec 29. Let’s call it sometime this week. The forecast involves several of the models developed by George Lindsay, but one easy-to-grasp reason is the chart below.
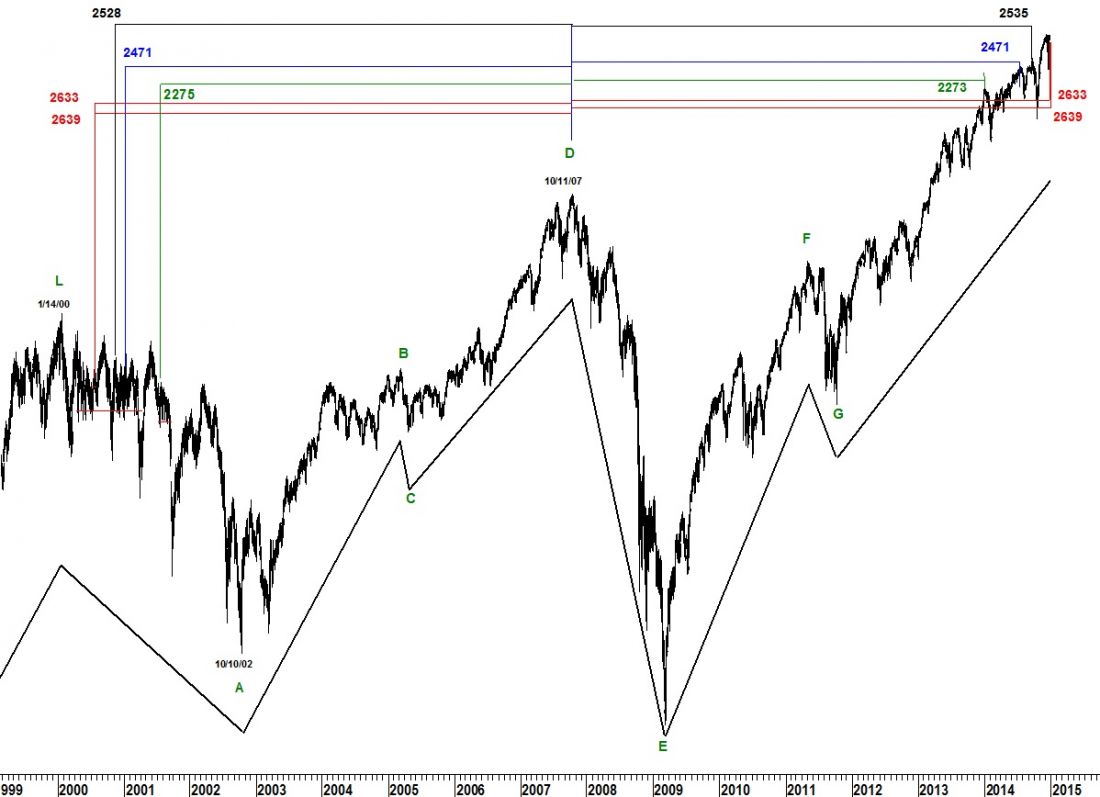
In the past, I’ve shown my personal discovery of centering a middle-section forecast on the high of the previous multiple-cycle to forecast the high of the current multiple-cycle. Previous forecasts this year using this model have all resulted in significant (tradable) corrections in the Dow.
The 12/31/13 forecast was off by two days, and that was followed by a decline of 1,204 points. The 7/17/14 forecast was an exact hit and saw a decline of 770 points. The 9/19/14 forecast was off by seven days and preceded a decline of 1,163 points. This model now has a middle-section forecast pointing to a high between December 26th and January 2nd .
#####
To get all the details of this forecast from SeattleTA, click here to “sneak a peek.”

