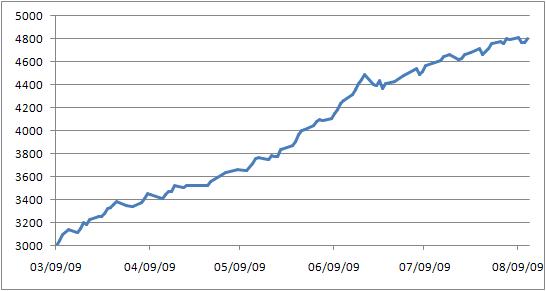
Note: The way each portfolio works is that I have what I call a rotating $3000 starting portfolio that is broken into three smaller $1000 accounts. This way I can account for cash settlement time but still play the market on every day. Each account I charge $4 for every buy and sell to account for costs of transactions. The Buy Pick Portfolio began on March 9, 2009.
Buy Pick of the Day Portfolio Results – August
| Date | Stock | Buy Price | Sell Price | % Change | Account 1 | Account 2 | Account 3 | Total $ |
| 8/3/2009 | UNH | 27.2 | 27.6 | 1.50% | 1553.44 | 4772.87 | ||
| 8/4/2009 | ERY | 17.4 | 17.31 | -0.50% | 1845.34 | 4755.24 | ||
| 8/5/2009 | OWW – SS | 4.55 | 4.37 | 4.00% | 1402.1 | 4800.88 | ||
| 8/6/2009 | AMD | 3.7 | 3.7 | 0.00% | 1545.44 |
4792.88 |
||
| 8/9/2009 | CMCSA | 14.95 | 15.15 | 1.34% | 1861.94 |
4809.48 |
||
| 8/10/2009 | PAAS | 19.75 | 19.23 | -2.13% | 1364.7 | 4772.08 | ||
| 8/11/2009 | ERY | 18.15 | 18.21 | 0.33% | 1542.54 | 4769.18 | ||
| 8/12/2009 | SKF | 28.35 | 29.20 | 3.00% | 1909.19 | 4806.43 |
Buy Pick Portfolio Career Results Graph
Sell Pick of the Day Portfolio Results – August
I started tracking these picks on 8/02/09 with my start here at Phil’s Stock World.
| Date | Stock | Buy Price | Sell Price | % Change | Account 1 | Account 2 | Account 3 | Total $ |
| 8/02/09 | 1000 | 1000 | 1000 | 3000 | ||||
| 8/03/09 | F | 8.83 | 8.58 | 2.83% | 1020.25 | 3020.25 | ||
| 8/04/09 | DHI | 11.4 | 11.1 | 2.63% | 1018.1 | 3038.35 | ||
| 8/05/09 | NE | 34.4 | 34.6 | -0.58% | 986.2 | 3024.55 | ||
| 8/06/09 | CAL | 11.7 | 12.05 | -3.00% | 981.80 | 2986.10 | ||
| 8/09/09 | DYN | 1.92 | 1.88 | 2.00% | 1033.3 | 2999.3 | ||
| 8/10/09 | DIG | 28.8 | 28.24 | 2.00% | 997.24 | 3010.34 | ||
| 8/11/09 | ERX | 33.35 | 33.19 | 0.47% | 978.44 | 3006.98 | ||
| 8/12/09 | MFB | 15.31 | 15.11 | 1.30% | 1038.7 | 3012.38 |
Good Investing!
David Ristau


