
Last weekend we said:


We have a lot of positive structure showing on the charts above.
1. Potential Head And Shoulders Bottom
Remember a big part of what we do are alternative entry points. A good example is most novices will wait for the neckline breakout to the upside to buy. Not us. We use the small blue right shoulder channel lines to do so. By the time the novices see the neckline breakout the leaders are long gone — not to mention we’ll be a lot further ahead of the game vs them.
2. Off the recent number 4′s listed in each chart above we have first thrusts up, now in Pullback Off Highs (little blue lines)
3. Full Stoh’s closer to oversold than overbought
4. A potential ABC up with us being in B
All of this is positive if you ask us, now it’s just a matter of the market making the call. Should we bust above the small blue channels (the what I need to see to take a trade) then that potentially gets the ball rolling.”
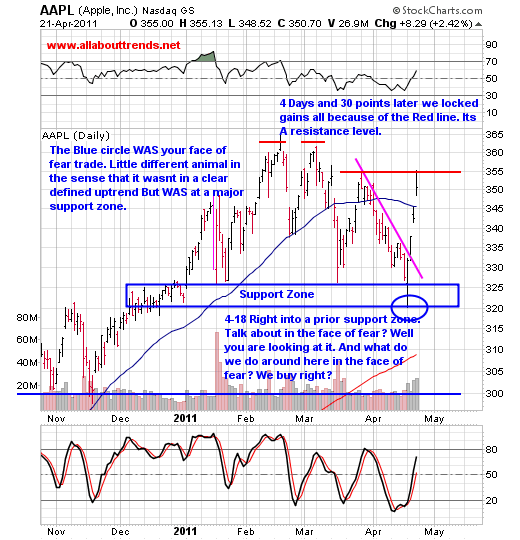
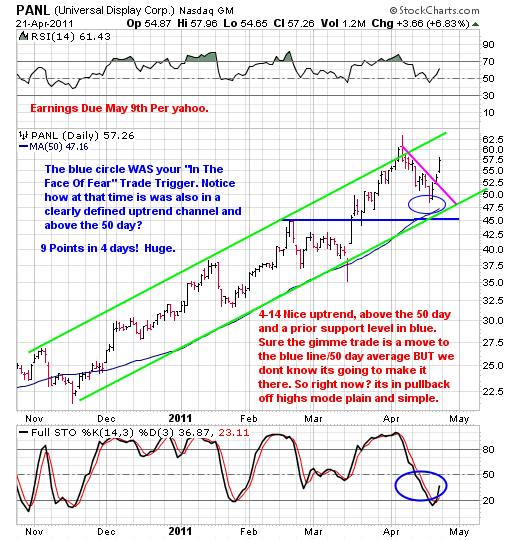
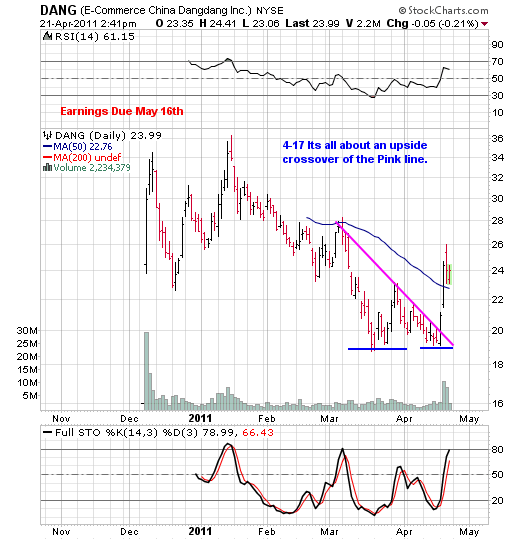
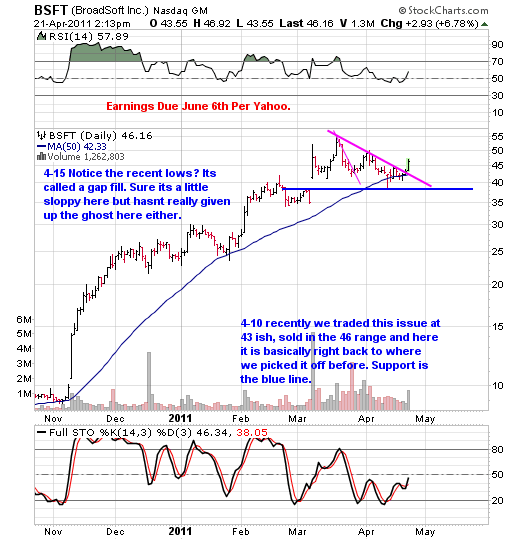

4-20 And here we are, the pink line was all you needed to know, all in advance folks, that’s called doing your homework and letting them come to you.
If you are interested in receiving a watch list of set-ups like these BEFORE they trigger trades, find out more by signing up for our free newsletter. You’ll also receive our free report — “How To Outperform 90% Of Wall Street With Just $500 A Week.”

