
Fundamental analysis is a method commonly used by stock market investors to analyze the intrinsic value of a security. This involves closely studying the financials of a company and using that information to evaluate its worth, or potential growth in the future relative to its current price. By focusing on metrics like balance sheets, debt levels, profit margins, cash flow statements and more, a securities fundamental analyst may gain insight into the company’s future performance and long-term value. This knowledge can then be used to make informed decisions about when to buy or sell a particular asset, often with good results. Fundamental analysis allows investors to look beyond simple technical indicators and identify opportunities for growing their portfolio over the long term. The purpose and core of fundamental analysis is to discover the core intrinsic value of an asset by analyzing economic data. In the stock market fundamental analysts study revenue, earnings, assets, liabilities, the management team, industry trends and macroeconomic factors to attempt to create a narrative, a present and potential future valuation.
Benjamin Graham was an influential figure in Warren Buffett’s life and career. He was Buffett’s mentor, role model, and professor of economics at Columbia University. Graham was a pioneer of a style of value investing – an approach that analyzes stocks based on their intrinsic value as opposed to their speculative potential – which made him one of the leaders in the field and caught the eye of a young Buffett, who had grown up with an interest in investing. After taking Graham’s class at Columbia, Buffett did not only gain valuable mentorship but also gained advice that he has applied to his own investment philosophy and incorporated into the strategies used today by Berkshire Hathaway Corp. As Buffett put it: “It is impossible to fully explain my great affection for Ben.”
Benjamin Graham’s seminal book, The Intelligent Investor, has become the benchmark for successful value investing and fundamental analysis. This book teaches readers how to make sound investment decisions by considering long-term market trends. The philosophy outlined in this book emphasizes the development of a rational attitude towards investments along with the application of tactics which have been proven to create successful outcomes. At its foundation, the premise behind this masterpiece is that an investor should take the time to carefully assess their financial goals define a portfolio strategy which has been built on research and analysis, execute it patiently and diligently monitor performance over time in order to adapt as necessary. In doing so, an investor gives themselves a chance for success regardless of unprecedented events in the markets. Benjamin Graham was a firm believer in the power of the price-to-earnings ratio to accurately assess stocks and make sound investments. His book, The Intelligent Investor, centered around this key metric to determine whether a stock was cheap or expensive. Graham proposed that a low p/e ratio (<18) indicated a stock was considered undervalued and therefore represented a potential good buy for an investor. Conversely, if a p/e ratio exceeded 17.5 then it was considered overvalued and probably not worth the risk of further investment. In the end, Graham believed using this simple but effective tool allowed one to make intelligent decisions about buying stocks and helped guide successful portfolio management. By emphasizing stocks with a low P/E ratio and focusing on the intrinsic value of companies instead of trends in their stock prices, Graham’s investing strategy has gone on to influence generations of investors.
Based upon Benjamin Grahams success and influence, financial ratio analysis has become a popular method of fundamental analysis for stock valuation: Financial ratios are used to assess a company’s financial health, profitability, liquidity, and solvency. Common ratios used in fundamental analysis include the price-to-earnings (P/E) ratio, price-to-sales (P/S) ratio, price-to-book (P/B) ratio, and debt-to-equity (D/E) ratio.
I have always found tremendous value in solid fundamental analysis. However, fundamental analysis can be very difficult and time consuming to do. It’s also very hard to find a good fundamental analyst.
Let me explain with a simple example.
Imagine you are looking at the following financial picture.
27-year-old individual.
$650,000 in debt.
$50,000 a year income.
What would you make of that situation?
If you only look at the numbers, I think we can agree that it’s an unmitigated financial disaster.
However, if then you uncover one more piece of financial information, the individual is a medical doctor fresh out of medical school, you end up with an entirely different interpretation of the future value of investing in that individual as an asset.
Therein lies the biggest challenge of fundamental analysis. Behind the numbers is a story and that story, when accurately understood, changes everyone’s understanding of VALUE. The problem of fundamental analysis is that there is always a narrative behind the numbers and trying to uncover the truth of that narrative is the challenge that faces every investor and trader.
For example, over the last 14 years, since the Great Financial Crisis, we have witnessed that companies have taken on an enormous amount of debt. This is evidenced by studying the debt-to-equity ratios of publicly traded companies. But unless you dig into that metric and understand what is being done with the debt the metric is useless. Let me explain. Since the Great Financial Crisis, the Fed pushed interest rates to zero percent. If a large corporation can borrow an immense amount of money at almost zero cost, it would make sense that they become massively indebted. The only question worth asking is what are they doing with that debt? Are they speculating? Buying competitors? Building infrastructure? Hiring more employees? Paying senior management exorbitant bonuses? Doing share buybacks of their own stock? The point is you always have to dig behind the ratio to try and understand the truth of what is actually occurring. This is no easy task.
It is important to differentiate between a stock market investor and a trader. A stock market investor and trader have different goals when it comes to the stock market. An investor is typically looking for long-term growth. They will purchase stocks of companies they research and believe in, holding those stocks for medium- to long-term periods. This provides them with a more stable investment return over time. On the other hand, traders are in it more for short-term gains. Instead of buying and holding, they are continually trading stock as they attempt to anticipate short-term swings driven by news or industry events in order to make a quick profit. Ultimately, what distinguishes an investor from a trader is the timeframe over which they intend to hold their investments.
Portfolio managers will often look at the price to earnings ratio of the broader stock market to try and determine what type of valuation the market is trading at historically. A very useful metric in this regard is the Case-Shiller price-earnings ratio. The Case–Shiller price-earnings (P/E) ratio was developed by economists Karl E. Case, Robert J. Shiller, and Allan Weiss in the 1980s. It is a measure of how expensive market prices are when compared to the amount of money a company makes per share in earnings, or profits. The Case Shiller price-to-earnings (PE) ratio is a tool used to assess the value of an asset and its ability to generate future returns. It measures the current stock price relative to average earnings over the last ten years, adjusted for inflation. This calculation gives investors an indication of those assets that are outperforming the U.S. stock market’s inflation-adjusted earnings growth rate. Unlike a regular price to earnings ratio analysis, the Case Shiller PE ratio allows investors to compare various investments outside of a single year period by accounting for inflation and long-term performance. Additionally, this metric can also be used by analysts across all markets since it does not require knowledge of an individual company’s finances or profitability in order to calculate its value. To better understand it, one should consider that a low ratio indicates that stocks are undervalued, and a high ratio suggests they may be overvalued. Additionally, the ratio itself can be used to compare different stocks across different industries at a given point in time. This can help investors decide which stock may be worth investing in based on its history and predicted future value.
Below is a chart of the Case Shiller P/E Ratio for the S&P 500 Index.
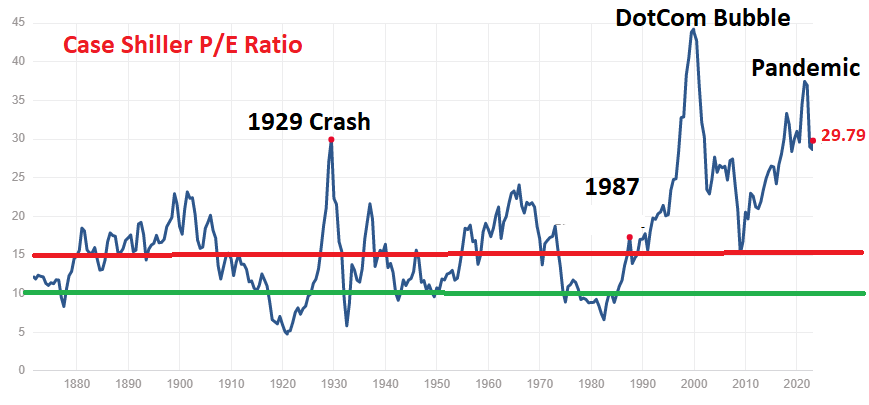
Let’s do some commonsense analysis of the Case Shiller ratio now.
The highest value of the ratio was 44.19, which occurred in December 1999 just a few months before the dotcom bubble bust. When the dotcom bust happened, we saw stocks like Amazon drop over 90%.
The lowest value of the ratio was 4.78, which occurred in December 1920. This was literally the exact bottom of what stock market historians refer to as the “Roaring Twenties.”
The median point for all 150 years of history is 15.91.
The average is 17.
It is currently at 29.79.
Stated another way, in terms of historical valuations we are trading at the 63rd percentile. But interestingly enough we are still at levels comparable to the 1929 stock market crash.
The challenge of this important metric is trying to understand what it actually means.
From a historical standpoint we are clearly overvalued.
But in my book, the issue is one of timing.
When we apply Benjamins Grahams wisdom to our analysis what can we learn? Observe how over the last 150 years every time the market broke above the 15 p/e multiple area into what he would’ve considered overvalued, it eventually retreated back to 10. The 15 multiple is the red line I drew on the chart.
The Green line is the 10 multiple.
But this has not occurred since the 1987 Stock Market Crash? Since 1987 we have traded as high as the all time high of 44.19 and retraced to the 15 level.
There are numerous prestigious fundamental analysts who for the last 35 years have been claiming the stock market is overvalued.
Before the Stock Market Crash of 1987, the S&P 500 Index was at $282. Today, the S&P 500 is trading at $4160. That represents a percentage increase of 1575% over the last 35 years. That is a long time to stay bearish and requires some very deep pockets.
The point is while we like to think that value is historically objective the behavior of markets proves otherwise. Eventually, an objective valuation of the markets will return but it can take generations as the Case Shiller P/E chart clearly demonstrates.
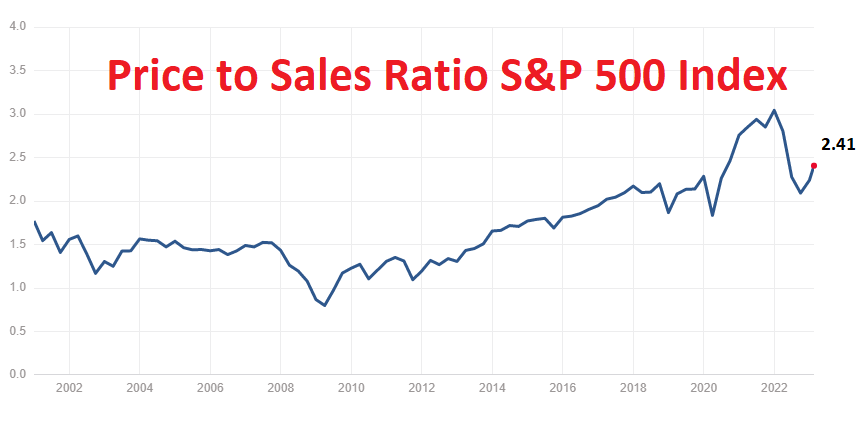
Another fundamental metric that analysts look at is the Price to Sales ratio. Price to sales (P/S) ratio is a critical metric used by fundamental analysts to gain insight into the relative value of a stock. This ratio measures the price of a single share compared to the sales generated per share by a given company. Factors such as market capitalization, revenue growth and profit margins are also taken into consideration in order to calculate the P/S ratio. Understanding the P/S ratio of any stock is important because it helps investors make informed decisions on when to buy or sell stocks. Generally, low P/S ratios are seen as signifying that a stock is undervalued and can be bought for an attractive price. High P/S ratios typically indicate that a stock is overvalued and may be suited for selling at its current price. Fundamental analysts creatively rely on this metric in order to discern investment opportunities and make significant gains in the stock market arena.
Here is a chart of the Price to Sales Ratio for the S&P 500 over the last 22 years. You can see that we are at the top end of the range. My challenge to fundamentalists is to ask the question, what does it mean? Where is the risk? Where is the opportunity?
There are a few examples of stocks that traded at or above 100 times earnings for extended periods of time yet continued to increase in price. I share these examples to illustrate how risk occurs in the financial markets.
Amazon (AMZN): In the late 1990s, Amazon was trading at over 100 times earnings, but its share price continued to rise as the company grew rapidly and dominated the e-commerce market. When the dotcom bust occurred in march 2000 Amazon lost 90% of its value very quickly. As of February 2023, Amazon’s P/E ratio is around 63.
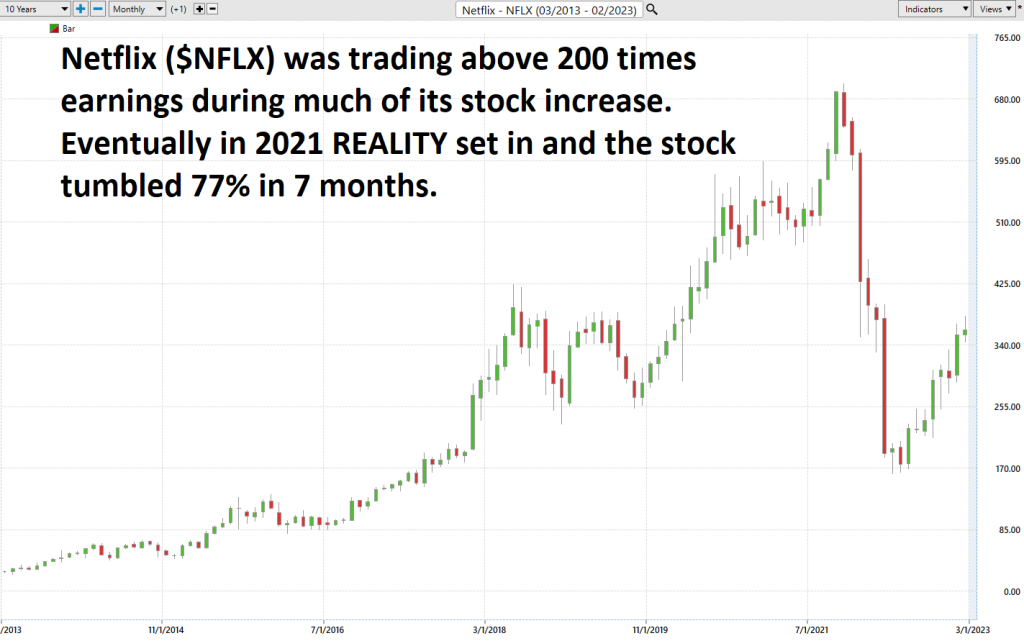
Netflix (NFLX): In 2013, Netflix was trading at over 200 times earnings as the company’s subscriber base continued to grow rapidly. The stock price continued to increase until 2021 when the stock dropped 77% in 7 months. $NFLX’s P/E ratio has since come down to around 65 as of February 2023.
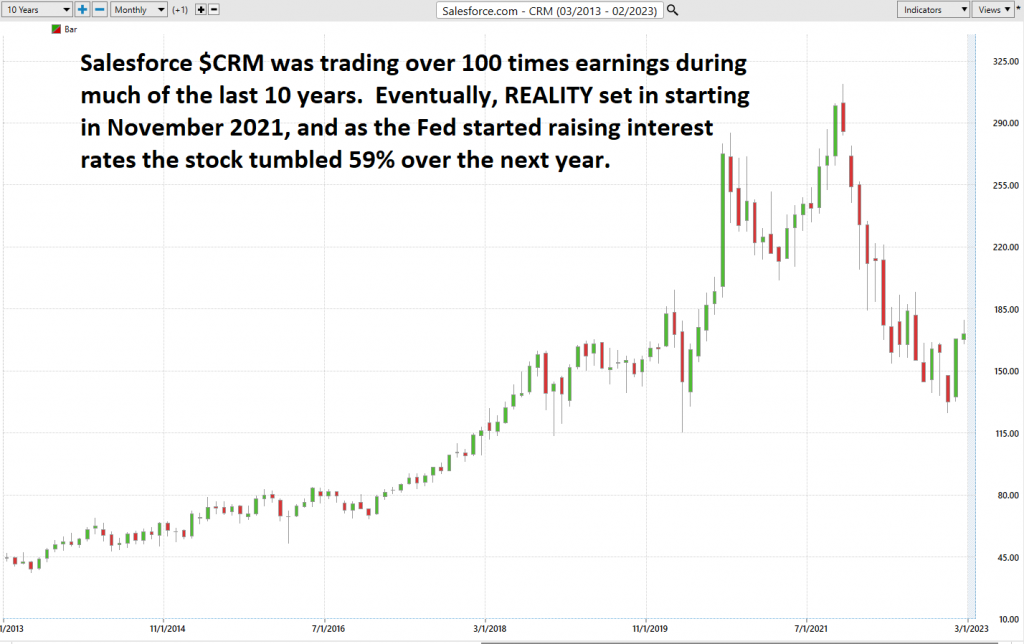
Salesforce (CRM): In the early 2010s, Salesforce was trading at over 100 times earnings as the company’s cloud-based software solutions gained traction in the market. The company’s share price continued to increase as it expanded its product offerings and grew its customer base. Then in 2021, as the Fed raised interest rates $CRM tumbled 59% in a period of 14 months. As of February 2023, Salesforce’s P/E ratio is around 84 today.
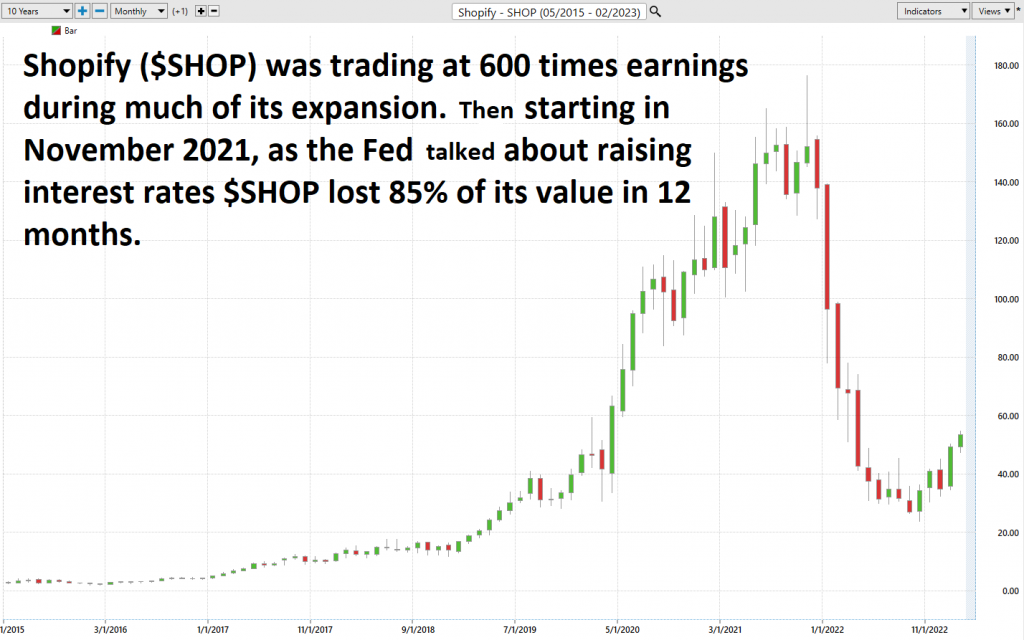
Shopify (SHOP): In 2019, Shopify was trading at over 600 times earnings as the company’s e-commerce platform gained popularity and its revenue grew rapidly. Despite concerns about the stock’s valuation, the share price continued to increase as Shopify continued to grow its merchant base and expand into new markets. Then in November 2021, as the Fed talked about raising interest rates $SHOP lost 85% of its value over the next 12 months. As of February 2023, Shopify’s P/E ratio is around 200.
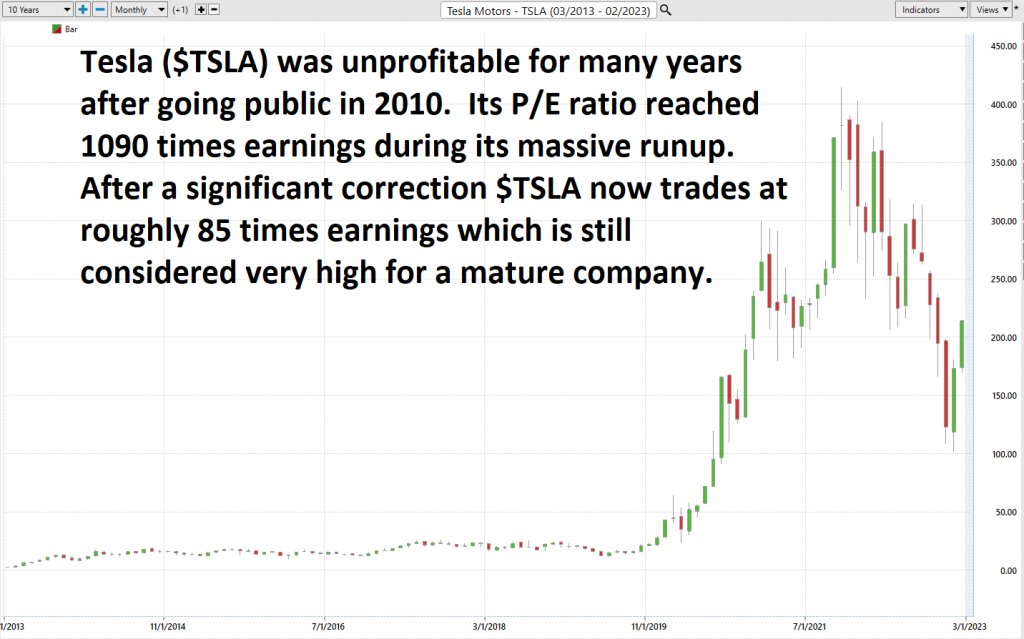
Tesla’s ($TSLA) price to earnings (P/E) ratio has been an interesting topic of discussion in the financial world over the past decade, beginning with its exceptional run for IPO back in 2010. While its P/E ratio was initially low, hovering around 58x compared to the S&P 500 market average of 15x at the time, it began climbing as Tesla’s stock surged over time, reaching a record high of 1090x during August of 2020. As of February 2023, Tesla’s P/E ratio is around 85, which is relatively high for a mature company in the S&P 500. Tesla continues to remain one of the most highly valued companies in the financial industry and its P/E ratio remains notably higher than that of most public companies.
The famous phrase “the market can remain irrational longer than you can remain solvent” is attributed to John Maynard Keynes, an economist and investor who lived in the early 20th century. This statement speaks to the vagaries associated with attempting to draw objective valuations from economic data. To put it simply, no matter how rational your advice or actions may be, it does not necessarily follow that the markets will respond in kind – and if you don’t have a comprehensive plan for weathering fluctuations you could find yourself unable to keep up with changes in the market.
Fundamental analysis is an important tool for traders looking to understand a stock or security’s value. By examining the underlying “fundamentals” of a stock, such as its financial statements, income statements, and balance sheets, traders can judge the intrinsic value of a particular asset. When used properly, this type of analysis can be helpful in defining basic terms like “normal” and “abnormal” to traders. It can provide insight into whether the current price for a stock is in line with its expected performance or if it is overpriced or undervalued relative to its long-term outlook. This information can help investors make educated decisions about when is the best time to buy or sell particular stocks.
Our recommendation is to combine fundamental insights with artificial intelligence to create better insights into timing entries and exits within a shorter-term trend. Artificial intelligence is revolutionizing the tedious and time-consuming process of short-term trading. With a solid fundamental analysis option, AI can provide traders with quantitative data, strategies and insights that put the probabilities solidly in their favor by empowering them to make smarter and more confident trades quickly. AI can monitor trading opportunities in real-time as well, allowing traders to take advantage of entry points or exit positions without missing key market trends or signals. By intelligently leveraging big data to identify optimal trading decisions within any given period, AI provides an excellent supplement for challenging and supporting the fundamental opinions for short term traders.
I am a BEAR on the stock market.
While I am not a fundamentalist, I do look at metrics like price-to-earnings (P/E) ratio, price-to-sales (P/S) ratio, price-to-book (P/B) ratio, and debt-to-equity (D/E) ratio. To my way of thinking the market is overvalued. But as I have hopefully demonstrated in this article, you must have very deep pockets if you are going to be a fundamental trader. Markets can go up several hundred percent before reality sets in.
Overvalued assets always fall much quicker than they rise.
What the a.i. does, is it affords me the opportunity to stay out of the market until the trend forecast alerts me that the BEARS are back in town.
Markets Go Up.
Markets Go Down.
Markets Trade Sideways.
Price is the only thing that matters when we are trading. It’s what can make you wealthy or decimate your account. Everything else is just noise.
Are you capable of finding those markets with the best risk/reward ratios out of the thousands of trading opportunities that exist?
Knowledge.
Useful knowledge.
And its application is what A.I. delivers.
Isn’t that what we all want from the markets? Consistency.
So, imagine what might your portfolio would look like today had you applied artificial intelligence to it five years ago.
See for yourself how a machine-based learning software makes it easier to find statistically solid trends with less risk.
Most traditional indicators that traders use today were developed in the 1970’s and 1980’s. They are incapable of telling you what the market is going to do moving forward.
Once again, machine outperforms humanoid.
Since artificial intelligence has beaten humans at Chess, Poker, Blackjack, Go and Jeopardy, why do we think that trading would be any different?
It’s important that you find out more and discover why artificial intelligence keeps traders on the right side of the trend at the right time.
Join us for FREE, Live Training.
We’ll show you at least three stocks that have been identified by the A.I. that are poised for big movement… and remember, movement of any kind is an opportunity!
Discover why artificial intelligence is the solution professional traders go-to for less risk, more rewards, and guaranteed peace of mind.
Visit with us and check out the A.I. at our Next Live Training.
It’s not magic. It’s machine learning.
Make it count.

IMPORTANT NOTICE!
THERE IS SUBSTANTIAL RISK OF LOSS ASSOCIATED WITH TRADING. ONLY RISK CAPITAL SHOULD BE USED TO TRADE. TRADING STOCKS, FUTURES, OPTIONS, FOREX, AND ETFs IS NOT SUITABLE FOR EVERYONE.
DISCLAIMER: STOCKS, FUTURES, OPTIONS, ETFs AND CURRENCY TRADING ALL HAVE LARGE POTENTIAL REWARDS, BUT THEY ALSO HAVE LARGE POTENTIAL RISK. YOU MUST BE AWARE OF THE RISKS AND BE WILLING TO ACCEPT THEM IN ORDER TO INVEST IN THESE MARKETS. DON’T TRADE WITH MONEY YOU CAN’T AFFORD TO LOSE. THIS ARTICLE AND WEBSITE IS NEITHER A SOLICITATION NOR AN OFFER TO BUY/SELL FUTURES, OPTIONS, STOCKS, OR CURRENCIES. NO REPRESENTATION IS BEING MADE THAT ANY ACCOUNT WILL OR IS LIKELY TO ACHIEVE PROFITS OR LOSSES SIMILAR TO THOSE DISCUSSED ON THIS ARTICLE OR WEBSITE. THE PAST PERFORMANCE OF ANY TRADING SYSTEM OR METHODOLOGY IS NOT NECESSARILY INDICATIVE OF FUTURE RESULTS. CFTC RULE 4.41 – HYPOTHETICAL OR SIMULATED PERFORMANCE RESULTS HAVE CERTAIN LIMITATIONS. UNLIKE AN ACTUAL PERFORMANCE RECORD, SIMULATED RESULTS DO NOT REPRESENT ACTUAL TRADING. ALSO, SINCE THE TRADES HAVE NOT BEEN EXECUTED, THE RESULTS MAY HAVE UNDER-OR-OVER COMPENSATED FOR THE IMPACT, IF ANY, OF CERTAIN MARKET FACTORS, SUCH AS LACK OF LIQUIDITY. SIMULATED TRADING PROGRAMS IN GENERAL ARE ALSO SUBJECT TO THE FACT THAT THEY ARE DESIGNED WITH THE BENEFIT OF HINDSIGHT. NO REPRESENTATION IS BEING MADE THAT ANY ACCOUNT WILL OR IS LIKELY TO ACHIEVE PROFIT OR LOSSES SIMILAR TO THOSE SHOWN.

